Definitive Guide to Skew-Ts and Hodographs - Part 1 - Components of a Skew-T

Vložit
- čas přidán 11. 07. 2024
- Welcome to my Definitive Guide to Skew-Ts and Hodographs! In this multi-part series, we'll take a deep dive into deciphering those complicated skew-T log-P diagrams and hodographs, which are both critical tools in severe weather forecasting.
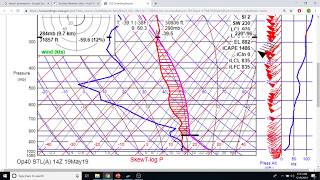
In this video (Part 1), we discuss just what all those lines on the skew-T log-P diagram represent. While it might look like a jumbled mess at first, each set of fixed lines has a purpose, and once you know what each means, you'll be able to better understand what a skew-T log-P diagram is showing.
Contents:
0:00 Introduction
1:54 Brief history of skew-Ts
2:36 Skew-T components
3:20 Isotherms (temperature lines)
4:23 Isobars (pressure lines)
6:24 Mixing ratio lines
8:16 Adiabatic processes, dry adiabats
10:55 Moist adiabats
14:10 Summary of skew-T components
16:00 Environmental/parcel profiles (observed sounding) - Věda a technologie


Questions? Comments? Feel free to post a comment below and I'll be happy to get back to you!
Thank you so much for making these!!! You're a great teacher!
@@sharessehughes2978 Thank you so much!
Is the mixing ratio basically equivalent to the relative humidity?
@@dailyrandomjokes9141 Mixing ratio is not the same as relative humidity but RH can be calculated using mixing ratio:
(mixing ratio/saturation mixing ratio)*100 = RH
So if warm enough, the MALR is negative for a bit? It actually heats up as it rises?
Take notes. You're going to need them later. For refreshers
I think I’m just gonna watch this series until I understand. Thank you for the videos!
Quite literally the best Skew-T primer I’ve ever seen. 👍🏻👍🏻👍🏻
Thank you so much!
i appreciate you making this soooo much. im a met already but i didnt learn about skew t-s to this extent in my undergrad. sooo grateful for u man
Thank you so much! Glad to hear these have been helpful!
I’m 12 and I’ve always been fascinated by weather, I keep seeing these and I don’t understand them so I looked it up and found this. I hope by the end of the 17 videos I’ll understand
You’re a very smart 12 y/o if you’re intrigued about stuff like this at your age. Keep your research and don’t let your creativity and curiousness fade away. If you like weather science then by the time you’re an adult you might find yourself a career on it.
@@jpusaf1999I wanna be a tornado damage surveyor
I searched far and wide on google but it was hard to find something i can comprehend relating to Skew T and hodographs but I found this video which helped so much. Thank you very much for making this video and enjoying it while making it. Ill defenitly have to check out the rest of this series, and you are so underrated its unbelivable. Thanks for making this I hope you get the recognition you deserve! ❤❤
Thank you so much for the kind words! Really happy to hear this video was helpful; hope you enjoy the rest of the series!
Amazing work
Thanks so much, Doug!
We are approaching Spring Storm Season 2023 in Oklahoma, and I will be coming back to this series to get a re-fresher on all of this. There's so much to digest here.
Howdy fellow Okie! I'm back too. It's nice to know what all this means now! I've spent 50 years just "feeling the air" and checking sat and radar. HA.
I want to tell u how grateful I am for this series. Its the best Ive seen on Skew Ts Thank you
Thanks so much!
Easy to understand and it’s very useful to forecast the weather
I legit learned so much from this series thank you so much! I’ve been sharing the playlist with my weather friends. Again I know a lot more now about forecasting severe storms and what to look for and it’s an amazing feeling! Thank you again😀
Thank you!! I'm really glad to hear this series has been helpful!
Thank you for this. I've been wanting a video like this for a while and you nailed it.
Thanks so much!
Excellent video and explanations! Looking forward to the rest of the series
Thank you sir!
Thanks for this, wanted to get into the spring season knowing at least something
Informative video been looking for a video(s) that covers forecasting in detail for some time now. The video helps a lot I’m just not one of those people that learns well out of a book. Can’t wait for future episodes and more in depth explanation of things. Thank you.
Thanks so much; happy to hear you found it helpful!
Amazing video!!! I can't wait to learn more!!! Thank you for this video as well!! 💖💖💖
Thanks so much!
Been a weather-devotee for many many years. Even fantasized once about pursuing an education in meteorology. Glad I didn't since I understood about 1.5% of this video, lol. To those of you intellectual giants who said this was easy to understand, I humbly bow.
You’re a great teacher, more please!
Thank you! More on the way soon!
Fantastic explanation!
Thank you Greg!
Thanks for this brother, this was the best breakdown of these so far, appreciate the extra help to understand these more deeply. SkewT graphs facinate me
Thank you so much for the kind words!
@@ConvectiveChronicles Of course! You and Tornado Titans should collaborate
Both of your channels have helped me so much in regards to predictive forecasting and understanding storms.
This will be my first year solo chasing, so I've been making sure I'm ultra confident this year!
@@Eggly69 That's awesome to hear! I love Tornado Titans' stuff. Best of luck chasing this year!
Wonderful you are the best teacher of meteorology on the web
Thank you for the kind words!
Thank you so much! This is really helpful. :)
Happy to hear that! Thank you!
That was awesome. There's no reason for me to learn this, but I'm all aboard now.
Thank you!!
Good video.
Thank you!
Very informative! I have Pivotal Weather and I cannot make heads or tails on the Sku-T charts on that website. Your videos are a definate help!
Thank you; I’m really happy to hear the videos have helped!
Thank you for the knowledge! Really clear and easy to follow explanation. :)
Thank you for watching! Glad it was easy to follow!
Awesome👍🙂 video. This is really helpful in understanding skew-Ts. My question was how can you measure the lapse rate on a skew-t without looking at the observations below it?
Thanks so much! You can estimate the lapse rate in a certain layer by subtracting the temperature (in °C) at the highest level of your layer of interest from the temperature at the lowest level of the layer, then dividing that difference by the depth of the layer (in km), where the depth is the height of the highest level in the layer minus the lowest level in the layer.
For example, let's say we wanted to find the surface to 3 km lapse rate from a sounding. We'd find the surface temperature and the temperature at 3 km from the sounding, find the difference, then divide by 3 km. Let's say the surface temperature is 18°C and the 3 km temperature is -6°C. The 0-3 km lapse rate would be:
(18°C - -6°C) / (3 km - 0 km) = 24°C / 3 km = 8 °C/km
Hope this helps!
@@ConvectiveChronicles That helps out very much thank you.
My question is how large are the "Parcels", for instance there is only one reading in mississippi near jackson, will it be the same for the northern part of the state?
Unfortunately, we can't release balloons at every geographical point, so there is a network of several stations to provide us a decent look at the atmosphere across the US. A Jackson MS sounding will be somewhat representative of the nearby environment, although it won't be perfect.
please go over EVERYTHING!
.
what does the Theta E vs pressure graph even mean?
what do the little blue vertical bars on the "winds with height" graph mean?
.
the wind barbs......storm motion vectors.... ALL OF IT!!!!
i want to learn ALL OF IT!
Don't worry...it's coming! I'm going to cover every single parameter on a typical SPC sounding in the upcoming videos (probably starting with the 4th video in the series).
Here from Reed Channel
I'd love to know if anyone was collecting lightning strike data during the solar storm we just had in May ('24). I'm interested in knowing if it's only cosmic origin particles from outside the solar system that may be nucleation events for strike initiation/create ionized channels in the air. I wondered if storms might show an increased number of strikes per storm.
Hmm, that’s quite interesting
Hey, I took a Weather and Climate course last semester and was told the Saturated Adiabatic Lapse Rate was 6 degrees Celsius per km. I was wondering if you provide some clarification on the matter.
The Saturated or Moist Adiabatic Lapse Rate is not constant like the Dry Adiabatic Lapse Rate is (9.8 deg C/km); it varies with parcel temperature and pressure. Generally, you want lapse rates to be above 6 deg C/km for more robust updrafts.
Makes sense. Thank you for letting me know!
Is there anything you would recommend knowing/ watching before this series?
Other than a baseline knowledge of weather and what a sounding is, not really anything in particular; this series goes in depth on all aspects of soundings, so you should find it fruitful even without much detailed meteorological knowledge
Thank you very much. I like to be thorough with my self study, and i have heard nothing but great things about your videos. Planning to attend school for met. After my gen eds are done, so filling in any information i can get@@ConvectiveChronicles
So it's a constant enthalpy psychrometric chart?
Sort of...
@@ConvectiveChronicles I guess constant enthalpy at a particular pressure? Probably has another name I'm not smart enough to remember/figure out this late in the evening.
To me it's interesting seeing how other fields deal with thermodynamics and the simplifications/shorthand they use, I'm a mechanical engineer.
I’m not 100% sure…but the function is similar to a psychrometric diagram, just a few tweaks in what’s plotted.
Why does the green line have so many movements?
Atmospheric data is never perfectly uniform, so there will always be very small (sometimes larger) variations as you go up.
@@ConvectiveChronicles ok, in the last part of the video there are very close variations of temperature between 6 and 9 km , from -20C to -5C again to -20C in a very short distance
thanks !!
@convectivechronicles thank you so much for this series. I came for the science and, sir, you delivered, and in a very concise way! This is, hands down, the best and most comprehensive skew-T log-P series of videos I've seen (and I've watched a lot). I learned so much, even though I felt I had a pretty good understanding already. I think a hallmark of a great instructor is the intuition you gain. This is a MUST watch for weather enthusiasts and students. Thank you again for the depth of information, and the work you put into this video series. 🫡 👏
Thank you so much for the kind words; they really mean a lot!