Definitive Guide to Skew-Ts and Hodographs - Part 2 - Constructing a Skew-T from Raw Data

Vložit
- čas přidán 3. 08. 2024
- Welcome to my Definitive Guide to Skew-Ts and Hodographs! In this multi-part series, we'll take a deep dive into deciphering those complicated skew-T log-P diagrams and hodographs, which are both critical tools in severe weather forecasting.
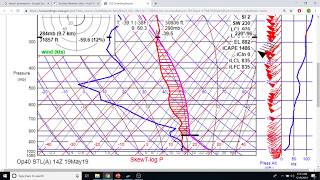
In this video (Part 2), we discuss how a skew-T is constructed from raw data.
Contents:
0:00 Introduction
1:48 Raw, encoded data
3:11 Tabular data
11:06 Constructing a skew-T
Check out the previous videos in the series here:
Part 1: • Definitive Guide to Sk... - Věda a technologie


Questions? Comments? Feel free to post a comment below and I'll be happy to get back to you!
Hey big dog, I don’t know if you read these but I’m a USAF weather forecaster and these are a huge help and a great learning tool, thank you for putting in the effort.
Thank you for the kind words; I really appreciate it! Really happy to hear the videos have been helpful.
So - I just added up the time of each of your videos in this & the upper air analysis playlists & as of this writing, between them there are ~9 hrs of quality educational content. That’s not even to mention the practical applications of these in your case studies. Basically a university level deep dive on this channel. Amazing!
Thank you! That's always been my goal with this channel, to provide high-quality educational resources in meteorology that everyone can access and enjoy.
If I have to do something like this while taking Met classes I’ll definitely be coming back to this!
This is so well put together and explained, it makes total sense how it formulates conditions! While it's now understandable, it is A LOT of data to absorb at once and your instantaneous comprehension at a glance is envied by us. Very much appreciate your time!
Thank you so much!
Fantastic series! Between this series and Tim Vasquez's "Instability, Skew-T, and the Hodograph" book, this aspect of weather is DEFINITELY a ton clearer. Thank you, again, for taking the time to put this together!! Subscribed! Take care...
Thank you so much for the kind words! I'm glad to hear this series has been helpful! Tim Vasquez's books are my absolute favorite; his Instability, Skew-T, and Hodograph Handbook is one of my favorites.
@@ConvectiveChronicles And thanks to your in depth explanation, I am seeing this MUCH clearer! It is GREATLY appreciated!!!
I love u dude! This was extremely helpful 😂 I Was assigned a set of raw data and was asked to plot a skewt in my mesoscale class. I was confusing myself by over complicating it but this really simplified it. So thank u!
So happy to hear that this helped!
This is an excellent way of explaining it much appreciated.
Thank you!
This is absolutely outstanding. Very good explanation on how to construct a skew-t. 👍
Thanks so much!
This is fascinating! Thank you for doing this. I have been wondering how to fo this for a while now.
Thanks so much for watching!
Oh I didn't expect this so early in the morning! 🤣 Another great video!
Neither did I haha! Looks like CZcams messed up my scheduling...oh well, thanks for watching!
@@ConvectiveChronicles 🤣🤣🤣 that's what I was wondering is if you had uploaded it and meant to private it or something 🤣 hope that it won't mess you up too much!! And not a problem! ❤
Thank you so much!
My pleasure!
I'm kinda surprised I'm still following. You may be good at teaching. Although how to usefully interpret or infer it sounds like a skill
I have a tempest weather station (that I love) but it has a few things that I can’t figure out what they mean. First is Delta-T temperature. From what I could gather I was thinking it is basically the lapse rate. Is that really what it means? One thing that seems off about the Tempest (let me know to anyone who has one) is the wind speed. I live right on the north east coast of Massachusetts on Cape Ann so we get nor Easter’s all the time with lots of wind. The thing is the highest gust it has recorded in the 3 years I’ve had it is 43.4 mph on 2/3/23. There is no way that’s been the highest gust. The blizzard/ bomb cyclone we got January 29, 2022 I could only get within about 30 yards from the ocean because the wind was literally pushing me backwards uphill. That wind had to be at least 60 to 70 mph or more. Anyone else have this problem with the Tempest weather station? Sorry for such a long comment.
I'll be honest, I'm not very familiar with Tempest weather stations. Delta-T I'd guess is a change in temperature over a certain period of time. In order for it to be a lapse rate, it would need to be taking temperature readings at two different heights, which is, of course, impossible.
As far as the wind, I'm unsure what the issue would be. Perhaps it could be a function of where you have it mounted that might artificially decrease wind speeds a bit.
@@ConvectiveChronicles thank you!
Wait...how did you go right of 30° with it being 29° and 25°? Im so confused and stuck at the plotting.
Correction, I'm an idiot. The lines are curved
Hey, plotting skew-Ts is hard at first. Please don’t hesitate to ask questions, even if they seem simple; happy to help.
You confused me at point 500 how does it happen that you plot negative ten near positive 10 I know I may not be making sense but it's confusing I'll rewatch again maybe I'll understand it better
Hmm, I’m not sure exactly what you’re referring to…do you have a time code? Always remember that the temperature lines are skewed, so it may look like it’s a different value than it actually is when plotted.
Really its beautiful. Got it. 👌👍Thank you very much. Can you share your email id please.
Thank you! You can visit the About page on the channel to send an email.