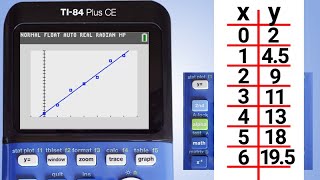
Statistics - Making a scatter plot using the Ti-83/84 calculator

Vložit
- čas přidán 22. 08. 2024
- This video will show you how to make a scatter plot using the Ti-83 or Ti-84 graphing calculator. Remember if you have extra functions on the screen you can shut them off by going into your y= screen. For more videos please visit www.mysecretmat...


This video was extremely helpful, short, informative, and straight to the point.
Thanks bro, 10 years later
when a stranger on the internet does something in 5 minutes what your teacher could not in 90 minutes
more like "figure" it out yourself"
Amen
Facts bro I don’t know the f is going on in class
When a teacher who has 90 minutes to teach 30 different students who all get stuck on multiple steps. Of course you're going to figure this out when you can see everything easily.
Being in college during COVID really sucks cause everything's online and you have to pretty much figure things out yourself. Thank you so much for putting up this video, it really saved my stats hw!
Bro I’m learning this middle school
Tell em about it, I learned honors chem from a screen
I failed my online Statistics class the first go around, and this time I'm doing so much better because my professor links your videos in our Modules. THANK YOU SO, SO MUCH!
Why was this about the same amount of information I’ve learned in my entire integrated 3 honors class for the entire year 💀
You have saved me sir. You get a like
You get a like for giving someone a like.
@@stephenjones6472 you get a like for giving someone a like for giving someone a like.
@@HereComesThe-Sun you get a like for giving someone a like for giving someone a like for giving someone a like.😂
OMG i LOOOOOVE it when they do it by hand. For some reason, when they use a computer, the person explaining the material does not explain WHY they do certain things or they skip steps. When they do it by hand, they have to take accountability for everything that they do and explain. I love this! thank you!
You are a LIFESAVER. So much easier than before.
I like how you went into detail about the y = part and how you could still keep it without having to delete it, thank you
10 years later and still useful and consice, thank you!
I laughed when he said “I put the new forgis on the Jeep i trap until the bloody bottoms is underneath cuz all my fellers got it out the streets”
Im grounded because i cant memorize every step by heart
The Papillon Warrior wow 😂
Poor guy you'll be alright don't ever give up
Are you still grounded
@@ShreksSon until my 18th birthday lmao
@@thepapillonwarrior1159 that was 4 years ago lmao. how old ru now?
I keep getting an error message when I hit graph.
Probably used a minus sign instead of (-) happened to me
Check to make sure you're using the right lists! For example if you have your x values as L1 and your y values as L3, then change the scatter plot YList to L3. This might be why the graph doesn't show.
My calculator didn’t have L1 so when u go to stat plot press enter and just put which ever list is available to u, I was having this problem hope I helped someone
you can use zoom 9 to make the plot and avoid the window button entirely
Not a bad idea once you get a good handle on manually adjusting the window. :^D
You just saved my entire butt. Thanks for clearing up hours of frustration.
What should I do if when I go to graph it says ERR: DIM MISMACH
1:Quit
yes
Mine says that too :(
There is likely a number in the y= setting. That was the problem for me
you dont have an equal amount of x and y values. ik this is a year late 😂
you can just hit the restart button lol. If you have stuff stored in the calculator then DO NOT. and yes i am replying after 2 years.
Wow this is so simple now, the math book basically told 25% in a much harder to understand package.
Very helpful for my lack of knowledge. Thanks queen
Thanks you saved my life, now im not dumb anymore
THANK YOU SO MUCHHHHH! LORD THANK YOU!!! 🙏🙏🙏
Love to see he is still hearting comments
You know it! :^D
Bruh!! Thank you!! I was dying over here!!!
Thanks, this helped me with studying for finals so much!
thanks bro the best video I found about this calculator
Why am I not getting the lines??????
Super useful and clear explanation!!! thanks a lot
Thanks for this video! It helped me a lot.
Thank you very much! Your tutoring worked for me!!
Excellent! Keep up the good work! :^D
Señor usted es el mejor
Thank you.
THANK YOU
But what if we want to plot 4 scatter plots at once? Are we just screwed?
YOU ARE MY SAVIOR OMG
BUT HOW DO YOU DELETE PREVIOUS DATA IN THE L1 AND L2 COLLUM
Select the column header and press delete. That should do the trick. :^D
What does the W mean and how does it get worked out in g(w-9)? It is tied to f(x)=x^2+2, g(x)=5-3x to figure out underneath those two.
I'm not sure what you mean. I didn't find a g(w-9) in this particular video.
I'm using a CASIO fx-991EX...... I'm not seeing a L1 or L2, it's only x and y.... and x and y are the only options (other than frequency), so no such thing as L3.... not sure what I'm doing wrong or if this is just a CASIO thing.
This looks like a fun calculator. I'll have to put it on my "wish list." Doing a quick search it seems similar to the Casio fx-9750GII.
How do you draw a line of best fit?
thank you it helped me a lot
Thank you so freaking much!
thanks a lot
Thank you so much
THANKS SM
THANK YOUU
thank you sir
When I go to plots, my 5th plot is turned on and cannot he turned off, does this matter. Help please 😭
I followed all the directions but keep getting an error when I try to graph it. Any idea why?
Try clearing the memory. If something is stored in your calculator, it could cause a error when graphing.
@@MySecretMathTutor how do I do that lol
Yeah but how do you enter the actual data
thank you
Lost me at “stat plot.” My ti84 doesn’t show anything saying “stat plot” but, instead, shows “plot 1” ,”plot 2” etc., and below a column Y1 =, Y2 =, etc. Anyone have a Ti84 like mine and is there a video for that which you know of?
Love it thanks!
anyone else has the problem that: invalid DIMENSION comes up?
How do I fix this?
How do we zoom out to see the whole picture?
Its kind of clunky, but you can go into the window settings and double all the x and y values so that you have a much bigger picture.
Now if only I could find the y intercept from there
Really great! thank you :-)
I have a calc test on Friday and I’m going to fail that’s why I am here
goat
how to delete the plot x list and y list
You should be able to clear them out by going into
[Stat] [List]
highlight the column and press delete.
Wait why was ur ymin -10 ??
Thanks bro
to set your winddow use zoom stat, where the hell did you learn to teach.
Thanks
How the hell do I clear I swear these calculators are so stupid
CZcams it.
sec,+7 1 2
for when your teacher speaks faster than eminem
Love u boo
I hate ads I’m in a test with 15 minutes hurry up ads
thank youu