How to do Linear Regression on the TI84 Plus CE

Vložit
- čas přidán 22. 08. 2024
- Learn the Steps to do a Linear Regression Problem on the TI 84 Plus CE Graphing Calculator
Buy the TI84 Plus CE on Amazon here: amzn.to/2zOKPTD
1:17 Adjust the Calculator Window for the Data
2:23 Setup Scatter Plot Graph for the Data
3:55 Turn on R and R Squared Diagnostic
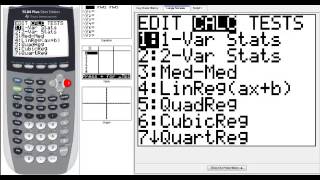
4:45 Perform the Linear Regression
6:09 Plot the Line of Best Fit


You remind me of my trig teacher in high school from 30 years ago. 98% got an A in the class from the way he taught. He made learning trig so clear and simple like you. Always had a red V-neck sweater with slacks.
Thanks for the compliment!
Thank you so much for the help wouldn’t have figured it out without you , life savior
Excellent explanation. You are a great teacher
thank you so much, I've been trying to figure this out following what my teacher said for 45 minutes, but you helped me get it exactly in only 7! your videos are helping me though AP Algebra II
Thank you for a measured and thorough walk-through. Resolved my questions in 2 minutes after having taken 30 minutes trying to figure out what I needed. I use the #8 LinReg so that my x and y are in a different order but everything else filled in the gaps.
This was the most helpful video so far. I was missing the stat plot 1 to b turn on to see my graph thanks!!
Glad it helped!
Got it right first try. Thank you!
you are such a legend help me so much for my psych stats final
your videos are helping me through college
so useful, now I can perform my exam well!
Thank you so much for posting this, it really helped me out.
Amazing video!!
Well done. Concise and clear. Thanks!
THANK YOU MR ROBERT WILSON
Thanks for the help!
Thank you from saving me from impeding doom, wish I was your student
Very good.
Rob you are "Da Bomb"! Thank youuuuuu!! :)
fr
God bless
thank you
thank u so much u r my saviour saranghaeyo xoxo
W robert Wilson moment
This video confused me so much, I tried going through and following it but my numbers are 1 2, and 3 digit numbers. my calculator said syntax error when I went to make the x min and y min one number below the smallest value. and then none of my points showed up on my graph. I don't know what to put for the scale because my numbers are 1 2 and 3 digit numbers. and when you said if the points arent showing up then it's wrong it would have been helpful if you could have explained what could have been done wrong and how to remedy it. All of my y values are 3 digits.
nice video
Thank you man😂
Thank you
I've followed your method and also have a r=0.91 , but no best fit line comes up, do you know why?
2nd stat plot -> on -> choose the graph type -> done
My TI-84 Plus don't open a window after I select LinReg(ax+b) like yours does at 5:01 and I can't figure out what to do next 😭 Theres no option to store the equation or select the x and y list inputs, so i have no idea how to move forward to get the linear regression
If you look at the video again, at the top of the window screen of the calculator, it says: "NORMAL FLOAT AUTO REAL RADIAN". Change your calculator settings to those settings by pressing the "mode" button which is next to the Blue "2nd" button. See if that corrects your situation.
Here are some more math tips! czcams.com/video/dQw4w9WgXcQ/video.html
W math tips fr! Make me feel 100 times more confident in myself for my exam! thx!