Boyle's Law Experiment: Data Analysis

Vložit
- čas přidán 5. 08. 2024
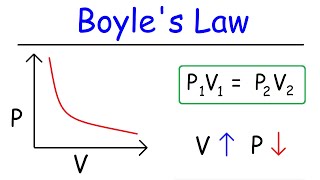
- Analysis of data obtained in the Boyle's law experiment (video here: • Boyle's Law Experiment... ) in which the relationship between gas pressure and volume at constant temperature for a fixed mass of gas is investigated. Boyle's law is one of the key foundations of the ideal gas law and so this experiment is relevant for GCSE science, A-Level physics and A-Level chemistry.
You can download the worksheet to try the analysis yourself - great for learning independently at home: physicshq.wixsite.com/alevelp...
Relevant concepts: Boyle's law, gas laws, ideal gas law, gas pressure, gas volume, direct proportionality, inverse proportionality, and testing for proportionality.


This is my second year teaching and this was very insightful. Thank you.
I don't understand
We doing this on Thursday in school and have questions based on it 😭 this is gonna help me loads, thank you
Great! Hope it goes well on Thursday.
Hello, great video. One question, why isn't atmospheric pressure added to the pressures? I understand that it is a manometer and only indicates relative and not absolute pressure of the gas.
Thanks a lot I finally found it
What sort of improvements can be made to this experiment to get more accurate results?
Improve resolution (precision) of volume scale.
Monitor temperature of the air column to ensure changes occur at constant temperature.
Repeat experiment to check if results are consistent.
Measure p and V over an increased range.
Sir what are simple four steps procedure to follow when performing this experiment
is there a way to calculate the uncertainty of the y - axis of graph p against 1/v ?
I would calculate the uncertainty of the gradient since it is the gradient that would be used to calculate a quantity (like R or n).
I’ve made a video on how this is done:
czcams.com/video/v-ROvD68ayw/video.html
What precautionary measure was taken to ensure that the temperature of the gas remained constant during the experiment
I reduced the pressure slowly. This reduces the friction at the valve which can be a notable source of temperature change.
thanks a lot
sir
You’re welcome, all the best with your studies
0:09 is there a specific name for the apparatus with the volume scale and oil column?
I’m not aware of one aside from “Boyle’s Law apparatus”. That’s how we’ve always referred to it
how to calculate no. moles of gas of the sample using the gradient of the graph p against 1/v ?
Graph has
x variable = p
y variable = V⁻¹
Relevant equation: pV = nRT
Rearranged equation to match axis variables: V⁻¹ = (nRT)⁻¹ p
Comparing this equation to y = mx + c yields: gradient = (nRT)⁻¹
So if the temperature (in K) was known we could determine n as follows:
n = 1/ (gradient × RT)
@@PhysicsHQ hold on, when you say y variable, do you mean y axis? it shows on your graph that your y axis is V^-1 so just confused, thank you
Good spot. Yes I did state it the wrong way around in the above comment. V⁻¹ is the y-variable. I’ll edit the comment.
why don't you get some experiment questions on this and show how to do the calculations
HI, thanks for sharing your thoughts. I have previously published a video that explains these calculations - czcams.com/video/xfVeDaiiNDw/video.html (though I think it needs redoing).
I do also have a worksheet that guides students through the manual calculations and their interpretation.
In your opinion do those things accomplish this suggestion?
That's some sexy Excel work.
If there’s one thing I can do pretty well it’s spreadsheets.
where can i download the application hes using
The application is Numbers
iOS: apps.apple.com/gb/app/numbers/id361304891
macOS: www.apple.com/uk/numbers/
What does the variable 'k' represent?
If the "k" in question is the "k"in the inverse proportionality relationship (p = k/V) which is the empirical relationship (i.e. the relationship that comes from the experimental data) then we can compare that with the ideal gas law: pV = nRT, and k = nRT.
Since the direct proportionality relationship does not explain the data the "k" in that relationship is not a valid constant.
Does that make sense?
can I get the application in android that you are using
The application I use (Numbers) is not available on Android. But Google Sheets is available on Android and can do everything I do in this video (and more).
Thank You Sir 🙏🙏🙏
You’re very welcome.
All the best with your studies.
We can't see your values your screen is far
🤭ur handsome. Oh thanks i understand .
Happy to help! Thanks for the compliment. All the best.