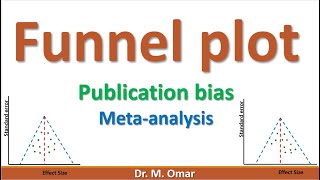
Funnel plots are a central part of how the results of a meta analysis are presented. Learn what they are, what they mean and how to interpret them with Rob Radcliffe.
Thanks for the feedback. Glad you liked it. There are lots of other videos on stats on the channel, including a masterclass on meta-analysis. Please share with friends an colleagues.
there are way more studies with high standard error of 2.5 than low standard error in the funnel plot - is this because it's just easier to produce studies (or make subsets of all data) that have high standard error?


Clear, consise and helpful. Thank you for this.
Thanks for the feedback. Glad you liked it. There are lots of other videos on stats on the channel, including a masterclass on meta-analysis. Please share with friends an colleagues.
Thank you very much! The Y-axis was not quite clear to me before this video! I can see the relation vividly now!
Thanks for this informative video on funnel plots. Thanks for the great explanation!
You're welcome. Hope you like our other videos too. Please share with friends and colleagues
great video with good explanation of reasons for asymmetry.
Thanks Robin. Glad you liked it! As you did you might also like our video on meta analysis - czcams.com/video/Wt79y0YutVc/video.html
really clear explanation, thank you
Great explanation!!!!!!!!!!
Really nice and clear explanation! Thanks for sharing!
Glad it was helpful!
there are way more studies with high standard error of 2.5 than low standard error in the funnel plot - is this because it's just easier to produce studies (or make subsets of all data) that have high standard error?
Nice explanation....
Thanks - hope you like all our other stats podcasts too
Thank you
Are funnelplots for Network-Metaanalyses aswell?
You can do 'comparison-adjusted' Funnel plots in Stata (using command netfunnel) for network meta-analysis.