How to choose the correct statistical test - or how to tell the correct test has been used

Vložit
- čas přidán 26. 07. 2024
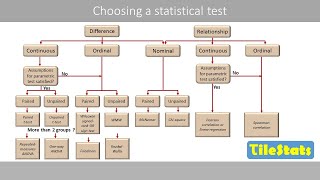
- Knowing how to chose the correct statistical test is essential if you're analysing data, reading a paper or sitting in the academic stations of the FRCS or National Selection. Watch this podcast by statistical guru Brett Doleman and you'll know how to chose the right test or know if the right one has been chosen. Using a step by step, easy to follow decision tree, Brett takes you to the correct test for the type of data you have. Statistical tests demystified forever!


This was super well done. I've been struggling with clearly understanding the criteria for choosing different tests, and your video was perfect for helping me make sense of it. 😊Thank you.
This flow chart format is excellent.
Thanks - glad you liked it! please share with friends and colleagues and check out our other videos
I found this to be extremely well put and super helpful. Thank you
Life-saving video! Clear and perfectly explained, thank you very much!
Lots of our videos might be life saving, so I'm glad we can add the stats test one to the list! Glad you found it helpful
This is really amazing lecture, I appreciate it.
Thank you so much for this video! These tests finally make sense
Glad it was helpful!
best video i could find! thank you
YOU EXPLAINED SO MUCH IN 20 MINUTES THAN MY TEACHER CAN IN A WHOLE SCHOOL YEAR! Very clear but kinda choppy table figure!
Hi - thanks very much! (sorry you didn't like the table)
Wow.....such an awesome video. Thanks a lot.
Thanks very much! We're glad you liked it.
Thank you this was helpful, very detailed, clearly explained, and presented in a way where it is actually captured my attention and interest.
Great to hear!
This video was very useful. Thank you! :)
You're very welcome :) please share with your friends and colleagues
Thank you very much Professor, It is a prefect lecture 😍😍😍
Hi - thanks for the feedback. Really glad you found it useful and hope you like our other videos too. Check us out on itunes podcasts and please share with friends and colleagues
This is excellent!
Thanks - glad you thought so. Please share with friends and colleagues
So if the dependent variable is interval or ratio data, it doesnt matter what type of variable the independent variable data is? Why is the independent variable type only addressed in the upper branch of the table?
Hi Where would Kaplan-Meier Log Rank test feature in this flow chart?
amazing video. thanks
I'm not sure but I think I hard "day-ty" data is already plural. The singular would be datum. Exceptional classification. Really helpful. Thanks.
Thank you very much professor. it is really very helpful. love and respect from Pakistan for you....
Hi - thanks for the feedback. Really glad you found it useful and hope you like our other videos too. Check us out on itunes podcasts and please share with friends and colleagues
great explanation! can you share more classes on subgroup analysis and prediction analysis! thanks!
HI - thanks. When we're planning more podcasts we'll take that into consideration. Glad you found this one helpful
Regarding the number of participants in meta-analysis, is it fair to report the number of participants per outcome or we report only the sample size? For example if 990 sample was used to assess outcome A and the same number is used to assess outcome B, can we report 990 or 2*990?
What would you use if you wanted to identify which factors (e.g. initial platelet count, gender) were associated with survival/death in invasive meningococcal disease? Your dependent variable is living/dying, which is considered nominal. My independent variables are both nominal (gender) and interval (or ratio, not sure, as you dont tend to get 0.5 of a platelet). According to your flow diagram, how do I chose what statistical test to use? Would it be a different test for each independent variable? (E.g. for platelet count and survical/dying it would be Logistic Regression, and for sex and death, it would be Chi Squared). I have got this example from an RCPCH revision book for Theory and Science, and they say "Multiple Logistic REgression" - But I don't understand how to get to this answer when using your flow chart
Which tool to use to measure motivation?
But I have a question:
If a research example:
1) There is 1 kind of cell, designed cell treated with more than 2 behaviour. Which anova do I use.?
2) there are 2 kind of cell, design cell treated with more than 2 behaviour but same amount of behaviour with (1). Which anova should I use?
It depends on the distribution of your data, but (I think) for:
1. You do a repeated measures ANOVA (if data is normally distributed) or a Friedman test (if data is not normally distributed).
2. One way of thinking of your data, is that it's made of three groups, instead of one repeated (cell 1) and one independent (cell 2). Then you can do a one-way ANOVA (for normally distributed data) or a Kruskal-Wallis (for non-normal distributions)
very helpful like me who is beginners on this kind of topic.
Glad it was helpful!
Really..............:/
14:30 these guys obviously dont know about woke culture & esg corporate scoring. im bi racial, bi gender bi religous gender fluid.