How to calculate Protein Concentration of Unknown Sample from standard curve in excel

Vložit
- čas přidán 13. 09. 2024
- This video explains about How to calculate Protein Concentration of Unknown Sample from standard curve in excel
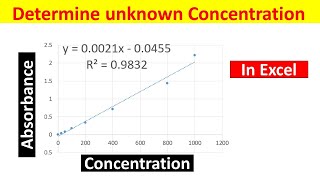
Simple method for the Determination of unknown protein concentration from standard curve in excel
Related Videos:
---------------------------------------------------------------------------------------------------------------
Plotting Bacterial Growth Curve: • Plotting Bacterial Gro...
Colony Forming Units: • CFU: Colony Forming Un...
Serial Dilution Methods: • Serial Dilution Method...
Copy Number Calculation for qPCR: • Copy Number Calculatio...
How to analyze Primer Sequence or Oligonucleotide sequence designed for PCR / qPCR: • How to analyze Primer ...
How to generate qPCR standard curve in excel and calculate PCR efficiency: • How to generate qPCR s...
Real Time qPCR optimization, Calculating PCR Efficiency: • Real Time qPCR optimi...
Taqman Assay Vs SYBR Green Assay: • Real Time PCR Assays- ...
Resolving poor PCR efficiency: • Resolving Poor PCR ass...
Calculating molecular weight of Unknown protein • How to calculate molec...
Designing qPCR Primers
• Primer designing for r...
Oligonucleotide Preparation & Purification • Oligonucleotide Prepar...
How to check Oligo Concentration
• How to check the Oligo...


Me not expressing my gratitude would be wrong! I really appreciate this video. So simple, so quick and so straight forward. I've been trying to figure this out for the past three days and yet, you've helped me in less than 5min. Really appreciate it bro!!🙏 Keep it up👌
Thank you so much! This was so useful and I can't believe it took me so long to work out
You are life saver ❤...I was very confused for this calculation but you saved me.. Thanks a lot sir🙏🥰
Thank you saved a lot of time doing my homework !
ahh thats amazing and so quick, cant believe is wasted a week on sorting it out, thank you
Thank you soooo much!! It's straightforward and easy to understand 😊
THANK YOU👍🏼👍🏼
Thank you very much sir. God bless you 💝
Thanks a lot, this literally saved my life
Thank u so much. I have to do this on next monday.
Thank you so much sir ....very helpful
This is so helpful
Can't thank enough🙏
Thanku so much sir..it helped a lot
thank you so much. life saver!
thank u for vedio please tell can we use your standard curve for analysis
its very useful for me thanks alot
very informative
thanks sir for detailed explanation
Thank you. Consider Subscribing.
you’re amazing. thank you
Thank you sir , Please make more videos on experimental data analysis like western blotting and PCR.
Nice Job!!
Thank you, its great video
Such helpful video 👍🏻
thankyouuuuuuuuuuuuuuuuuuuuuuuuu sir 🤗
well explained
Nice explanation
And very useful video
Thank you.
Thank you
Thank you for making this!!!
this was such a help. Thank you very much
Amazing video thanks a lot!
this really helped, thank you so much!
super helpful, thank you!
Damn!! This is great... Thanks a lot
You're amazing man
super usefull!!!
Very nice...
Thank you, great video! But I don't understand how I should interpret the concentration after I calculated them? To what I should compare them? if I need to know the severity of the sample, what's the limit I should compare to? Is it the positive control? and how I say this sample is negative? is it negative with its concentration equals to the negative control or less? please help me :(( I have an ELISA report to submit
The trendline should pass through origin as per the operating procedure. When chosing the option to display R^2 in the excel, there is an option to set intercept. Make it 0. The final equation will be of form y = mx. That is the calibration equation which needs to be used for determining the unknown concentration.
Hope it answer your question. Enjoy learning!
Sr how you calculated intercept value
It’s a great video! Thank you so much! But when I calculated my protein concentration, it came out negative. Does anyone know what it means? 😢
me too
this might be because you have not diluted your protein standard to 1mg/ml if this is the case your absorbance value for your protein standard would be higher than 1 (into the range of 2-4). This is likely the case that results in a negative value.
thanks
If straight line equation is y=mx-c..this standard curve also considered as correct or not??..please answer sir
how to calculate phenolic content by Spectroscopy ?
Exam m computer ni milega intercept or slope value calculate krne k liye, manual calculate kr k b dikhana tha
In case of undiluted samples, shall we correct the OF with the blank or not necessary?
Sorry OD value
Can you give me the formula for determination of protein
@Bio-resource can you please tell me how to convert from ug/ml to ug/g of FWM, it's urgent please help me brother
How to calculate the o.d reading at 660nm for 0.1ml,0.6ml.....
what if the od of unknown samples is out of the od of standard reagents?
Hi,
You can dilute the unknown sample to fall into the standard's range.
I got negative values while substracting....what does it mean?
❤
👍👍👍👍😍😍
Can you explain how do you find the number 0.34, .132
Where is the negative 0 ug/mL control?
you need to adjust the content
Hi.. didn't get you. Could you please clarify?
Its not a standard curve if you use a linear fit...
Bunyi video tidak bagus
its not clear you have to details more..i dont like your explanation
Thank you so much. This is so amazing
thank you