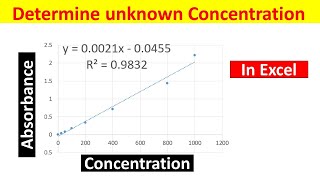
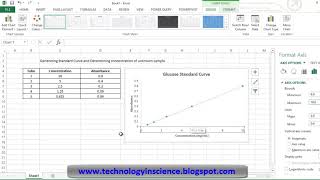
Generating Standard Curve and Determining Concentration of Unknown Sample in Excel

Vložit
- čas přidán 7. 09. 2024
- In this video, you will learn how to Generate a Standard Curve and determine Unknown Concentrations in Excel by a Simple Method. A standard curve is used to accurately determine the concentration of your sample from the signal generated by an assay. I will show you how to create a standard linear curve using Microsoft Excel and how to use it to calculate unknown sample values. I will use imaginary data of concentration and absorbance as an example. I have used excel 2016 to generate a standard curve and determine an unknown concentration of compound. You can also use other versions of excel such as excel 2013, excel 2019 and excel 365.
#standardcurve #teachingjunction #excel #concentrationvsabsorbance
Other CZcams queries:
Absorbance vs concentration,
How To Create A Linear Standard Curve In Excel,
Generating Standard Curve and Determining Concentration of Unknown Sample in Excel - Simple Method,
How to calculate Protein Concentration of Unknown Sample from standard curve in excel,
Generating Standard Curve and Determining Unknown Concentration in Excel,
Plot concentration vs absorbance scatter plot,
Calculate the concentration of the unknown sample from the absorbance measurement of an unknown sample,
Add Trendline,
Using Excel for a Calibration Curve,
How To Create A Linear Standard Curve In Excel,
how to create a linear standard curve in excel,
standard curve in excel,
how to make standard curve in excel,
how to create a standard curve in excel,
how to make a standard curve in excel,
standard curve excel,
standard curve absorbance vs concentration,
standard curve,
standard normal curve,
standard addition calibration curve,
how to plot standard curve,
unknown concentration from standard curve,
how to make standard curve in excel,
gallic acid standard curve preparation,
how to draw standard curve,


How to Add Error Bars of Standard Deviation in Excel Graphs: czcams.com/video/_HzNHrcCmv4/video.html
you saved my lifee, ThHANKYOUUUUU
My pleasure
Very useful.... thank you so much
Welcome 😊
Can you make a video on how to compare our results with a standard?
Thanks for your suggestion. I have note down your suggestion
Thank u so much
You are welcome
How did you find the value of concentration, as well as absorbance? please let me know
Thank you
You can get these values from experiment. I have used imaginary values for demonstration purpose
can we use this equation to calculate conc. if unknown sample absorbance value higher than ploted values?
Yes
Please how to found the number 0.0249
how do we know that the calibrated graphic that we made is correct sir?
There are multiple factors. Firstly, make sure that your values falls into a linear range. Secondly, the value of correlation coefficient and coefficient of determination is also indicate the accuracy of calibration curve
Why u use 0.0249x like where did u get the value?
That is the intercept value. you can get this value from regression equation generated by excel
Please find the unknown concentration without the trend line equation. It's highly advicable not use the equation in most experimental reports
Do you mind sharing how to go about doing that?
TREND(select the concentration of std.,select the O.D of std.,select the O.D of unknown sample)
Do this in excel
why you chose value 0.484
sir how did you get the value 0 .0249
What is the answer please if you know now
you thumbnails videos hidden the video at the end of the video
please remove it
Thanks for your suggestion. I have modified the end screen
Don't use English title for your video if you are not making an english video. It is very cheep when you do a video in your own language and use a title from another languages.
Actually, you are a cheap person. Think before you speak. I am using English language as teaching medium. The people from more than 50 countries are taking advantage from these video. You have a sick mentality