SPC in excel sheet, Cp & Cpk calculation with graph OR control chart

Vložit
- čas přidán 19. 02. 2020
- HI I am S.K Sharma
Welcome you on CZcams channel hub of knowledge
here you can Learn Industrial technical documentation
TOPICS as giSPC in Excel sheet
Cp , Cpk calculate in excel
control limit calculation
Average calculation
range calculation
standard deviation calculation
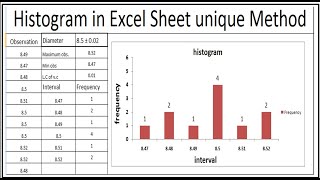
histogram in excel
what is bar braph
what is control chart
how to make and draw control chart for Xbar & Rbar
control limit in xbar chart and rbar chart
contact for documentation 8076920822 - Věda a technologie


So nicely elaborated sir. Grate video..👍
Great video please complete full video
Very good sir ... Dear sir mene QHI dekha Ask mechology dekha but Mera doubt abjake clear hua h... thanks
Great❤❤❤
Nice video
Excellent explanation
Most simplify and easy to understand sir g👌
Excellent presentation Hats off
Clearly explained sap in excel. Nice vedio
Great lecture
Nice, it's very useful for an engineer
Great day today
Excellent video sir
Nice explanation sir ji
First class hats off ur mind blowing Teacher sir.... ❤️
Thanks 👍 dear for watching
Nice explanation sir
Hello Mr Sharma, it is very useful, Thank you so much.
Amuthan do you interested for getting industrial documentation training
Hello sir , very informative video .Loved it .Learning is easy in your style.plz make histogram video .And plz clear wether control chart is required for cp cpk
Badiya sir
Nice practical
Nice explain sir
Please upload second part of histogram
Sir ur spc session is amazing....but how can we get remaining session of this video...
God bless u sir
Hello Mr. Sharma video is very good however please mention control chart 8 rules which indicates where process is in control or not, because your process seems to be in control but we need to follow 8 rules.
Nice video
Very good sir
Hi Sir, please teach how to make histogram in spc format.
It's a nice teaching and we hope u will make more videos related to quality.
Thanking you very much.
Bhai mila video ??
And also where did the standard values taken please reply
Thank you
Thank sir
Please sir give link for next histogram topic in spc same this data please continue video
Sir kindly tell me, what a minimum tolerance limit for SPC performing
How how to define D3 or D4 and D2
What is fee for in-house training for 7qc tool and 5core tool
Drawing me to bahot Sara dimensions hota hai kis dimension ke liye spc banaya jaye???
Sir if we take LCL(Xbar) up to two decimals only then the value 6.645220 would become 6.65
Sir Interval or Freq. Kse dali jati hai
Thanks u sir
Dear Amurtham Please subscribe channel
Hello dear do u interested online course
Do u not interested for getting started online documentation training course
why I am getting different result of ucl and lcl using formula xdbar+3sigma and xdbar-3sigma ?
Explain d2 and a2 value
Thanks 🙏
Please subscribe channel and share to your friends
Do u come interested for getting started online documentation training course
Sir can you send me Excel format
What is d2 Value
Why cpkl value is more than cp value
सर इसमें आप a2 d2 कैसेकैलकुलेट करें
Sir what is A2 and D2& D4 in spc and where we can get
Sir ye USL LSL kaha se aata hai? Maine ye topic bht jyada nhi pdha hai lekin mjhe Cp &Cpk calculate krna hai
Kisi ko pta hai to plz reply?
Sir ,
How to take A2,D2,D3
I don't know
Please exlain
Hi sir,
How did you get the D2 value..
Bhai woh ek standart value hoti hai.. jaise quality main iso hota hai usme bhi kayi standard hote hn to d2 ki value fix hoti hai
Bhai download link dedete
Sir why cpk is less than cp kindly tell me
Dear sir , pls tell us how to calculate D2 ,A2 and D4 .please sir
Jagabandhu thanks for visiting my video...dost D2,A2, D3 are constant of variations taking from standard table,..... please share my videos to your friends
@@HUBOFKNOWLEDGEMECH sure sir...
Hello dear do you interested for getting online documentation training course
Jagabandhu do u interested for getting industrial documentation training
Can i get the template, please?
How to calculate USL and LSL
Thanks for approaching me, watch my video for calculation of USL and LSL, LCL and UCL
Video name is specefic limit Vs Control limit
What is a D2 A2 and d4
Histrogram cha mention kiya nahi ,spc concept complete nahi hua aisa lagata hi sir
Sir yaha
CP lower cp uppper Kaha se aaya
Both Hindi and English shall be better
Sir d2 samjh me nhi aya
Do you teach online?
Yes right now I am teaching online if you interested contact on WhatsApp 9891719133
please sir send to us spc format
Ok send your email id
Hi dear do you interested for getting online documentation training course
what is formule USL and LSL? why is USL= 6.700 and LSL=6.600? WHY ARE YOU CALCULATİON?
Sir if we calculate standard deviation with the mathematical formula then the value comes out is
0.0099378066
Nice video