Show last 6 months based on user single slicer selection

Vložit
- čas přidán 31. 07. 2024
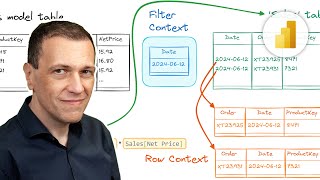
- How to use calculation groups to show the behavior of any measure in the last 6 months (or any other number of months), starting from a single date selection with a slicer.
Article and download: sql.bi/704248?aff=yt
How to learn DAX: www.sqlbi.com/guides/dax/?aff=yt
The definitive guide to DAX: www.sqlbi.com/books/the-defin... - Věda a technologie


Thank you. I love that you move through the example step-by-step to help us understand how the calculation works.
Thank you for sharing in such a detailed step by step explanation. It is brilliant and it worked perfectly.
This is the best solution for Rolling KPIs using a filter selection for month that I've seen. Thanks Alberto
Once again.. Brilliant. You and your channel were my 2021's best find and I don't think anything will top that. Thank you !
WOW!! explained in such detail so the implementation is absolutely clear - AMAZING Alberto!
This is Fantstic Alberto!! Thank you for sharing! Very clear with excellent demonstration of steps and the (interim) results we should expect along the way. I have been looking for something similar (a 10 year rolling average) for a few weeks and you’ve answered a ton of my questions. I should be able to do what I need to now!!
Nice one. Always a Joy to see you breakdown DAX in simple terms
Holy moly, thank you very much, you deserve more viewers, awesome content with amazing explanation!!
This is wonderful. We struggle with Current month reports as using dates will hide PriorMth on the first few days of the month, where business wants to see PM sales until the day after the first Sales day to CurrentM. I do with the a [LastDayWithSales] measure & a binary date table calculated column as a filter. But this UX requires to unfilter the binary [Current month] filter then choose a date range.
Your solution here is fantastic. Thank you so much
What a Couple! Always start up looking everywhere and always end up in the Italian place. Thanks So Much.
Thanks very much Alberto / SQLBI. I've been wanting to solve this conundrum for ages and here it is. Thank you for your clear explanation
Damn !! Thank you very much. Thrilled to understand the reason behind every single step.
I applied this solution using a Sparkline for a KPI Card. It's really helpful and useful for my company. Thanks Alberto!
Your solutions are so elegant. Amazing work.
Thank you so much I've been looking for that for a loooong time and you are the first explaining it properly. Looks like i'm going to watch all your videos ;)
This video was incredibly useful! I was trying to figure out how to have a dynamic KPI visual that has a rolling 12 month graph based on date slicer selection and this did the trick. Thank you very much!
How did you manage to Solve the rolling 12 sum? When you say rolling sum, do you mean the rolling sum for each month or does the rolling sum only for the months that are present in the visual? 😊
Great Video , Great Explanation , love it . thank you to come online and sharing . love all your videos ...Love Dax
Genius solution. This saved me so much trial and error! Thank you, Thank you, Thank you!!!!!
Superb.. I cracked it what I was looking for and it was for only month end dates.. Great One Alberto.. 🙏👏
I was wondering from past 2 days everyone explained but not explained every single steps to perform.
Thank God you save my time and i got the solution now.
Thanks a ton!!
Grazie mille per la tua spiegazione!
As always, excellent!
Greetings from Brazil!
Excellent video, so intructional and well-explained. Filter context is examined deeply and the reason for each filter manipulation becomes clear. This pattern will be certainly used with some modifications, thank you for this vid!
You save my project at work! Thank you for this, well done!
Wow. This solved my issue. Can I say WOW once again. You are the best.
This is a great solution! I'm using and it works very well, the only issue is if there is no value in a period, it will skip the month instead of showing 0, in a table the result is even worse with a missing month, but thank you anyway! 😎
This is exactly what I needed in my current project. Thanks Very much.
Thank you Alberto, DAX Guru. :)
This Channel helps me a lot.
Grazzie Alberto, for insurance loss ratio reporting with premium and claims and a loss ratio % this is an amazing solution. i spent most of the past 2 months trying to build this with a slicer and then trying to set dates back etc. i have stopped chasing, and can start implementing !!
Thank you very much! Your explanation is perfect. Exactly what I need.
Awesome man ... you guys are simply Ninjas of Power BI
Fantastic, the explanation of filter context is great. Thanks!
Thank you alberto,
You literally saved me !
Keep the great work.
I love your videos! Such a good teacher! Thank you!
Always finding solutions here! Thank you Alberto!
Awesome! Solutions to actual customer's requests.
Thank you Alberto, DAX Champion. :)
This Channel helps me a lot.
You are champion on DAX and post o through with your channel i am trying to get all your knowledge
I have one query
Thank you very much Alberto, some time ago I had to solve this scenario, however, this approach is much better and more elegant
Amazing
Very grateful for this instructional video! It bugs me that PowerBI makes things that should seem so simple seem so complicated. In Tableau, things like this are accomplished in much less steps and with also very limited coding
Thanks Alberto, really useful and helped a lot in one of my deliveries.
Incredibal .... Amazing Alberto.. Many thanks.. It helps alot in my project.
You make it look so easy!!!
Incredibly useful. Thank you very much!
Thank you Alberto. The same solution works for the new sparkline feature!
It is great especially the filter part! Thank you!
Hello Alberto, thanks for this very informative video!
Just a question, you're displaying a calculated data in your example (Total Sales). I was trying to display volume (Distinct Count) per month to which I cannot implement the "CALCULATE" function. Would you be able to suggest what should I do?
Thanks Alberto. I was using sqljason's method for this purpose but it fails if we want to show values from 2 different tables. Your method works brilliantly. I used what-if parameter for the previous N months selection.
Thank you!!! This is exactly what I was looking for =)
Another milestone! Thanks!
Thank you so much! You are truly a life saver :)
Thanks for a great video Alberto! I was wondering if this could be used to only show data for every 6 months before a date for a past X amount of years? For example company A’s most recent date is 6/1/21 and looking to see sales on 12/1/20, and 6/1/20, but company B’s most recent date is 3/1/21 so sales 6 months from their date would be on 9/1/20 and etc.
If not possible to use this type of example, do you have a similar video? Thanks!
This is great, thank you for your help.
Best teacher ever
Ciao Alberto
Thanks for this video! Great work as always.
I am using this a lot when showing trend graph however I never duplicated the calendar table. Instead, I was using order date/delivery date from the sales table formatted as month year or yyyymm and then dragging it into x-axis.
My measure looks very similar for example:
CALCULATE (
SUM ( 'Sales'[Quantity] )
, DATESINPERIOD ( 'Date'[Date] , MAX ( 'Date'[Date] ) , -13 , MONTH )
)
Is there any disadvantage of this solution?
All the best, Przemek
I currently use a technique like this when providing financial reports, I am also having the data presented by our companies fiscal year and crop year to date CYTD and FYTD from the respective cost centers. The challenge I have is showing the "future" months as well to look at rolling forecast as well as total Budget. I dont use calculation group, and my model right now requires about 5 measures just to give me FYTD based on a current date or any date you wantto type in and it re-calculates the measures based on that date. Thank you for this video. Could you show how you would implement this, but in a companies fiscal year to date measure ( powerbi knows the first month of the fiscal year regardless of what date you set as input?). Thanks again.
Thanks for the video!
When we click on the month axis, it will cross-filter other visuals on the same page. The cross-filtered visuals display incorrect result because the filter context from calculation group will be applied. Is there anyway to prevent this inside the code instead of manually disabling cross filter for each visual ?
Excellent video, thank you so much! wondering if you are able to share way to show the previous 3 months and future 3 months... where your selected value is the "pivot" column of the chart. For example, I'd like to be able to see the revenue targets from the past N months and also the revenue targets for the next N months.
Need this for some custom tooltips. Thank you!
This worked after checking out ~5 other solutions and made sense.
You’re amazing! Thank you.
Amazing and well explained.
it's sooooo cool and delicate! thank you very much !
Glad I found this video and am a big follower of your videos and articles.
In this video exercise, how to bring MoM and QoQ based on months or quarters displayed when period is selected by the user. I am getting MoM measures for every month column which is wrong. Only latest months or quarters to be considered. My fiscal period is in rows.
Alberto as always you re a Dax Lord
Very clever! Thanks for sharing.
This is great presentation
Thanks for this useful video. Brilliant solution!! It works perfectly for me and best thing I got it at the right time. @Sqlbi
Hope you will have a solution for the simple yet hard to find solution in DAX.
I have a matrix table with metrics at the row and week ending date (calendar table) at columns. I want the latest week to come at the start but power BI put it in default ascending order. Please suggest.
Thanks again!!
Thank you.
Curious to know the reason for shadowing date table, creating inactive relationship and then bringing it back in the measure?
With single date table, capture selected date, ignore the filter coming from slicer and calculate amount for last 6m based on selected date, returning blanks for any other months. Finally apply a visual level filter to overcome blanks.
Also noticed that calculation groups mess the report when there are other visuals on the page. Isselectedmeasure to be used additionally. Appreciate such videos 👍. Thank you
Awsome, much appreciated 👍
Ooohhh. This gave me some cool ideas!
Como sempre, excelente
Very helpful! Thank you!
amazing, worked perfectly
Really Helpful Sir.
This is awesome !
Thanks Alberto. Well explained and easy to implement. I have one issue though. I have noticed that if one or more months in my N period does not have data, that particular month is not shown in the chart. If I set "Show Items with no data" to ON, then it ignores the Previous N months to show filter and shows all months (months less than (current month - N months) and months greater than current month). Could you help?
Same issue! Do we have solution for this?
Hi, great video i've loved it so useful, i have a problem, eg : when i try to show the last 6months for march2020 it takes in consideration the months only so it shows feb,jan,dec,... for 2020 all of them.so i want dec,nov for 2019 how to solve this ?
Great! Thank you for the solution, chatgpt wasnt much help here, i guess its too complicated :D
Did it with weeks instead. Now the next problem is finding out how to make a "year to selected week" with the same slicer, where the year can change depending on which year the week belongs to.
Got it to work, if anyone should have the same need. Just an edit of the code from the video. Again thank you, would never have solved this alone.
m__offeredYearToWeek =
VAR RerefenceDate = MAX( 'Calendar'[date])
VAR FirstOfYear = DATE(MAX('Calendar'[weekBelongsToYear]),1,1)
VAR NumberOfDays = INT(RerefenceDate - FirstOfYear)+1
VAR PreviousDates =
DATESINPERIOD(
'Calendar previous'[date],
RerefenceDate,
-NumberOfDays,
DAY
)
VAR Result =
CALCULATE(
[m__callOffered],
REMOVEFILTERS( 'Calendar'),
KEEPFILTERS(PreviousDates),
USERELATIONSHIP( 'Calendar'[date], 'Calendar previous'[date])
)
RETURN
Result
Fantastic, thank you!
You saved me!! hahahaha
Incredibly useful!!!!
Very Nice video. We have an almost identical case but in our case we use a month table that is related to the fact table. So the dim_month and fact table have a key yyyymm but also a endofmonth date. So If we want to do the same ss in the video we need to rewrite the Logic here. We want 12 month backward from a selected year month. Perhaps it is possible to get a date without selecting the period slicer like last date/period with data
Excellent solution! I do have a question if you have a solution for if I for each month would like to show the sum of the Last 12 months i.e. like a trailing LTM for the last 12 months still only selecting a single month.
Brilliant! Thanks!
Fantstic! Thank you.
I m dead with all this knowledge!!!!!
Another great video.
Great Solution Alberto!
This solves creating dedicated measures either for the visual or the visual filter.
I wonder, couldn't the same result be achieved using only a single calendar table?
your are amazing man
Thank you for the wonderful explanation.
love your all videos but my Date field hierarchy gets removed which is creating problem for slicer, Any solution on that?
Thank you so much..
Do we have video for complete Mquery/measures
Hello Alberto. I have same use case as you're showing, but with one difference. I need to compare last n months based on user date selection with last n months same period, previous year. That means, that I need to have mm instead of yyyy-mm on the axis. How would you then sort months (e.g.: selected date february = 2 ; 1, 12, 11, ...). I did it with DAX measure, which is fast, but the code is quite long and not elegant at all. Thanks!
I used field parameters (Mth/Qtr/FY) on Category of waterfall chart, and the out-of-the-box experience is that it would not show 'waterfalls' from beginning up to the first data point set on the axis/category. Eg. When 'Qtr' is selected, chart will plot 4 data points on the axis, and then draw 3 sets of waterfalls between the 4 points (duh~). The first set of waterfall to depict the movements from beginning of period up to the first data point would NOT be shown, contrary to 'normal user expectation'.
Certainly not a bug here but it is such a wet blanket to not have easy to implement dynamic axis parameter on the waterfall chart. Thankfully the technique here enabled adding a period dynamically to the front of whatever periods have being selected to serve as a 'beginning' axis point. Thus when user select a year, the measure would consider 1 additional period prior user's selection.
For details sake, the measure i used was a balance-todate that accumulates cash movement to show a balance at the last day of selected month. Hopefully this comment helps someone struggling with the same issue, particularly with waterfall chart.
very well explained video, is it possible to apply the same technique for the last x weeks
Hi Alberto! I tried this method and worked perfectly but now i'm curious: How would I adapt the code to see only the months in the current year select. Meaning if I choose April 2021 I only get to see April, March, Feb and Jan 2021.
Thank you
Thank you, thank you thank you.
Thank you for such videos❤. Although I have some different scenario, I have YYYYMM slicer on my report page with multiple years of data.And data is loading on monthly basis. Currently I have saved YYYYMM slicer with recent 12 months selected but client is expecting if new month data gets loaded again recent 12 months should be automatically updated. Any input on this please.
Great solution, I am using to show last 3 quarters for all my measures, but is it possible to show last 3 years YTD before the 3 quarters like this dynamic column based on user month enddate selection 2018-12,2019-12,2020-12,2021-03,2021-06,2021-09. Thanks.
This is a super video!! I implemented it as best as I could, however, the 6 months & associated values are showing correctly, however, I'm getting all of the other months also, but they are showing as zero. Any tips on what could be happening would be greatly appreciated.
What about having a disconnected date dimension and use it for filter and use the date dimension in X axis of chart.
Informative as always.
One question if you would be so kind, how should I modify the code to work with a previous year sales measure?
Thanks a lot ,but I have a question,can we create a virtual table to replace the table created for the previous date?
Great Video, Thanks.
Q: When I select FY 2021 & Jan in the slicer, my line chart needs to show April till Jan data. same as when I select Dec, it needs to show April till dec only, How can I achieve this