Normal Quantile-Quantile Plots

Vložit
- čas přidán 2. 01. 2013
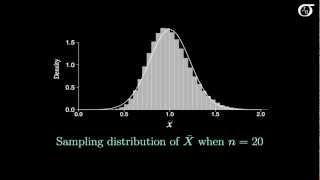
- An introduction to normal quantile-quantile (QQ) plots (a graphical method for assessing whether a set of observations is approximately normally distributed). I discuss the motivation for the plot, the construction of the plot, then look at several examples. In the examples I look at what a normal quantile-quantile plot looks like when sampling from various other distributions. I then illustrate what normal QQ plots look like when sampling from a normal distribution by simulating several samples, for two different sample sizes.


You, sir, are a gentleman and a scholar.
You're welcome! I'm glad to hear that you find me clear and concise!
both, very.
I loved the way you explained how the th quantiles are calculated. I was confused with different formulas other people have used in their videos without telling the underlying concepts. Keep it up!
I looked everywhere to find out why some use i/(n+1) and (i-0.5)/(n+1) . . . . while others use /n and not /(n+1) . . . . thanks for providing a pragmatic clarification of the use of a . . . . I was locked in this whirlpool and you got me out . . . keep well
I have looked at many videos on CZcams, and yours are the best with many visual concrete examples. Not only Q-Q plot but also other concepts in statistics. Thank you very much.
Thanks for the kind words! I'm glad to be of help!
This explained it far more clearly than my prof did, Thanks a lot
You are very welcome Ryan. I'm glad you found it helpful.
Really appreciated the simulated values at the end so we could get a visual feel for it. Thanks!
This is the best explanation of QQ plot, period.
Thank you very much.
This is very helpful, you are so much better, more concise, and clear in your way of teaching than my university teacher :)
Thanks
You're welcome. I'm glad you found it useful.
I was watching your videos on the Hypothesis Testing playlist, and this video was a perfect supplement! Thank you for posting this and explaining all concepts so so intuitively and in a well-motivated manner!
You are very welcome!
Finally, I understood this thing
Şimdi ben de istiyorum 80 80 p
My favorite source for statistics learning! Thanks for the excellent work. It really helps!
I'm very glad to be of help!
Thanks Frâncio! I'm glad you liked it!
This was the video that made it sink in. Thanks much!!
You are welcome Susie, I'm glad to be of help!
Thank you so much! Clear and comprehensive!
Great video. I was struggling with qq plots and you made the concept very clear.
I'm glad to be of help!
Excellent explanation and illustration of QQ plots and distributions.
You're welcome! I'm Glad to be of help!
Thank you so much for this video. Explains Q-Q plotting very well.
You're welcome. And thanks for the compliment!
Really nice introduction, and very informative
Perfectly explained!
Thank you very much. It is a very clear explanation!
Very well presented! Thanks a lot :)
Very Nice and well explained in simple terms..thank you..!!
It was a very helpful video on q-q plot! Thanks a lot.
Very well explained. Thank you!
Very nicely explained!
This is a very good explanation. Thanks.
great video. really helps in building intuition.
absolutely amazing!!! loved this video. Big thanks!
You are very welcome!
Thank you very much. You are my lifesaver!
Thank you, sir. You saved me again.
Make sense, very clear. Thank you.
You are a saviour 🙏 🙌.
Thanks for such a great tutorial, the best one that I catched so far. It would be nice to post the R codes somewhere in your website.
Incredibly good!
This is really helpful, thanks a lot!
I had referred many lectures, could understand better than any. Thank you so much
You are very welcome!
so touching for an excellent video
this is great. Now i can understand what R is doing! :)
Your video is better than the lecture I'm taking...
Thank you so much for this.
Really good explanation!
thank you sir ! amazing experience
thanks for clear and perfect explaination. Good work
You are very welcome!
Excellent! Excellent! Excellent!!!
excellent description
So concise and clear. Thank you.
+Audilia S You are very welcome!
Super useful, thanks 👍
Helped a lot, thanks!
great video, cant find similar videos elsewhere
OH MY GOD THANK YOU! 3 minutes it the "Oh!!!!!" moment hit me.
What a great video. Superb job! Subscribed!
Frâncio Rodriguesbn Jr is a CT yes you y me for the rest of
very helpful. thank you
Fantastic explanation, thank you
You are very welcome, and thanks for the compliment!
Awesome work!
Thanks!
Excellent!
At 5:10 or so: "We plotted the ith ordered value..."
i = 1, 2, 3, 4, ..., 9 (since n = 9).
The short version is that there are 9 values, so we split the distribution into 9 + 1 = 10 equal areas.
You'd just have to look that up in the standard normal table in the usual ways. I have videos illustrating how to do this ("Finding percentiles using the standard normal table", or something to that effect). There are 2 main types of table, and I have videos for each one.
You're welcome!
It helps a lot! Thank you so much!
I'm glad to be of help!
Seriously. Much appreciated.
good job... pretty clear
thank you very much for this quick and clear explanation. It is fantastic.
You are very welcome. Thanks so much for the compliment!
YES! I have also been watching this series! Very well-explained!
James A. Chen Thanks James. I'm glad to be of help.
You're the greatest!
Thanks Fyodor!
great one
You literally saved me !!
Glad to be of help!
great video
Thank you !
it's very good and very simple explane!
Thanks!
well explained
thanks great video
Thanks!
Superb
Great video! I only didn't understand how to get the straight line. Which are the first and third quantiles, the smallest and third smallest values of my sample?
Ohhhhhhhhhhhhhhhhhh! I got this! yeah! finally!
thanks a lot!
+Juan Salazar You are welcome!
Finally!
Thank you.
You are very welcome!
Can you please give some references for the function you used to approximate the quantiles? The (i-a)/(n+1 -2a) formula? Where does it come from?
How do you find the z values from a normal distribution chart? I have a problem that say x= 0.8, i=.10, z = -1.28? How do I get that from the table?
Great
Thanks for your helpful videos!!! QQ plot tells us whether the sample data itself is normally distributed or not, would you mind explaining how do we know whether the sample data come from a normal distribution...?
I'm really not sure what you are asking. The entire point of this video is normal QQ plots, which can help us assess whether the sample data appears to be approximately normal, which, in turn, can suggest whether it's reasonable to think the sample came from a population that is approximately normal. We never know for certain, as we don't know the distribution of the population unless we're simulating. But normal QQ plots can help us make a judgement call on whether the normality assumption is reasonable.
Thank you so much for your reply, that was exactly what I wanted to ask. Apologise for my unclear explanation ..@@jbstatistics
pretty darn straight line XD
Thank you very much for your video. In the video, you splitter up the normal curve into 10 areas which is easy to do. How about if we have a sample of size 10 and we want to split up the curve into 11 areas?
It's pretty much the same thing. Choosing 10 equal areas makes for a simpler looking plot, and is a useful simple example, but the overall method stays the same for any sample size. For example, if n = 9 (so we are splitting the curve up into 10 equal areas), to find the appropriate z value to plot the minimum value against, in R we would use the command qt(1/10). If n = 10 (so we are splitting the curve up into 11 equal areas), to find the appropriate z value to plot the minimum value against, in R we would use the command qt(1/11). Cheers.
jbstatistics Great. Understood now. your Chanel is the best. I appreciate your help.
how did you get .1 under the curve?
Impressive
Thanks!
@ 6:11 ,how did they come up with (i-a)/(n+1-2*a) , where a is a chosen value from 0 to 1/2 ? Would appreciate it for a link to a good, credible explanation. Thanks all.
can you explain why at 6:45 those different formulas are the same? I'm confused...won't they yield different answers? When my teacher did it, he put (i - .375)/(n+.25).
There are different adjustments that have been suggested. They do not lead to the same values of course, but overall they all give a very similar picture.
could you kindly answer my question? Thank you! Not quite understand why in the strongly right-skewed distribution, the largest values are larger than would be expected, in the right-skewed distribution, there should be less large numbers than small numbers(the probability of the random variable to be small is higher)
It's all a question of how the distribution compares to the normal distribution. Try thinking about it this way: start with a normal distribution, then grab the right tail and pull it out to the right, such that it stretches out and more of the area is contained in the far right tail (then there was when the distribution was normal). Now we've got ourselves a right-skewed distribution. We can shift and scale it such that it has the same mean and variance as the original normal distribution, but there is going to be more area in the right tail. In a typical sample, the largest values we get are going to be greater than would be expected under normality. I hope this helps!
very clear thank you sir !!!!! I am studying in university as a year 3 student and sometime I see this in my course material
4:42 on the x axis, the values range from -1 to +1. Are they z score?
The values on the x axis are theoretical quantiles of the standard normal distribution. They aren't based on sample data, so they are not z-scores in that sense, but they are z values from the standard normal distribution.
@@jbstatistics How do you get these theoretical values or Z values that you plot as x-axis?
When n = 9, i/(n+1) = 0.1, 0.2, 0.3, ...
Why did you choose Z=-3 and Z=3. Is there a formua to choose Zmin and Zmax
I like my Q-Q plots like my orientaintion, pretty darn straight..
Thanks but how can we use "standard normal table"?
This table is scary 😿
Try to give presentation on outlier test in statistics. Single Grubb test, multiple grubb test etc ......
why is it -3 to 3 on the horizontal axis