Video není dostupné.
Omlouváme se.
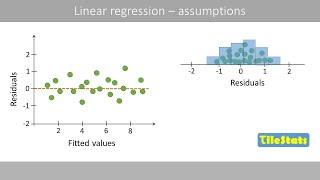
Simple Linear Regression: Checking Assumptions with Residual Plots

Vložit
- čas přidán 4. 12. 2012
- An investigation of the normality, constant variance, and linearity assumptions of the simple linear regression model through residual plots.
The pain-empathy data is estimated from a figure given in:
Singer et al. (2004). Empathy for pain involves the affective but not sensory components of pain. Science, 303:1157--1162.
The Janka hardness-density data is found in:
Hand, D.J., Daly, F. , Lunn, A.D., McConway, K., and Ostrowski, E., editors (1994). The Handbook of Small Data Sets. Chapman & Hall, London.
Original source: Williams, E.J. (1959). Regression Analysis. John Wiley & Sons, New York. Page 43, Table 3.7.


I'M GIVIN THIS VIDEO THE BIG CHECK MARK
Thanks!
ME TOO + A BIG SUBSCRIBE
@@read89simo + A BIG LIKE BUTTON
this was posted 11 years ago T-T and has the best explanations and videos on statistics I have ever found, thank you so much for all your hard work and legacy, i hope you know you're my savior.
I'm glad to be of help! 11 years, where'd they go? :)
"think you guys should get more views..."
Thanks! (And I'll take as a compliment that you said "you guys", since this is a one man show.) Getting lots of views isn't very high on my priority list -- I'm just trying to provide the best resources for my students that I can. (I haven't done any promotion, and I don't allow ads on the videos.)
There are many students in intro stats in North America and around the world, and I'm glad that some of them find my videos helpful.
I'd upvote you x10 if I could just for the anti-advert policy.
One of the best, if not the best, video on regression analysis I've seen. Thank you very much for creating it. Your service is highly appreciated.
Nkululeko Shabane You are very welcome, and thank you very much for the compliment!
This is exactly what I have needed. My professor goes over these plots but has been doing statistics at a high level so long that I think it's hard for him to relate to someone who is new to it. I really needed someone to just explain it all from start to finish, and you did that. Thank you so much! Your videos are so, so helpful. Sincerely, a first year statistics graduate student.
I'm glad to be of help!
"The residual plot removes that increasing trend and then re-scales the y axis, so it's a little bit easier to see these issues.. sometimes in the residual plot." Now that is some serious insight. Thank you so much and this video was superb with really excellent examples!
Thanks for the kind words!
You are very welcome Simon!
Excellent methods used to help students learn in this vid. This is the future of education!
Thank you for this excellent lecture. It certainly helps.
I was struggling to understand the assumptions in simple linear regression through other sources. This video has made it clear
I'm glad you find them useful John. Best of luck in your course!
Very good videos about simple linear regression. Thank you very much for creating them!
You are very welcome!
I'm so fricking glad these videos align well with my UIUC stats class. Much appreciated!
Prof Balka knocks it out of the park every time! We miss your videos. Could you do some videos on multiple linear regression? Hope you come back soon with new vids!
Thanks for the compliment! I'm trying to make time for video production, but probably won't get back to it until the new year. It's been a busy few years, but returning to the videos has always been part of the plan (with multiple regression videos up near the top of the list). Cheers.
YAY!! Thanks Prof !! I will look out for them.
Small...and then they're big...and then they're small...and then they're big..
Great video, pretty simplistic, but very useful, thank you!
JB thank you so much you have helped me more than you'll ever know! My only suggestion to you would be to create playlists for associated topics. Other than that your teaching methods are incredible! Thanks!
Thanks very much for the compliment Shaydoyle! I believe I do have playlists ordered by topic. I've also set up a website (www.jbstatistics.com), which keeps the videos in a more organized fashion. (I'm not plugging anything on the site - it's just organized lists of my videos.) Cheers.
We often simply rely on an appropriate sampling design or experimental design to ensure independence. But if, say, we have recorded the observations in some sort of time order, then plots of the residuals through time can give us some indication of whether the residuals are correlated.
very clear, easy understandable video
The more I watch your video, the more I hate my uni. Much love man
you are great man . thanks for your content . I am forever great full to you .
This is a definitely a great video, thank you! You are awesome!
Thanks a lot! All your videos on stats are very clear and have been very helpful!
You are very welcome!
Thank you
Need more like these videos on outliers in residuals
This was very useful, thank you for all the information
You are Awesome! Thank you so much for sharing your valuable knowledge.
Thank you very much jb statistics. This is incredibly helpful and well explained.
+Peter Song You are very welcome. Thanks for the compliment!
Thanks for their video.. Short and sweet...!!!
You are very welcome!
Good video, thank you very much for uploading it.
+Mostafa Ali You are very welcome. I'm glad you found it useful!
good and simple explanation of residual plots and assumptions.
Thanks!
thanks for this great explanation sir .....
Very good Explanation Sir.Thank You
This was very helpful! Thank you!
4:12 "I'm giving this the joker variance, because *let's put a SMILE on that FACE!* "
Thank you for this useful video !
you are such a great teacher...
Thanks!
Great video!
im giving this video A BIG CHECK MARK (2)
Very useful video ! Thank you
So helpful! Thank you for this :)
LMAO BRO WHY ARE YOU HERE
Seline Chung WHY ARE YOU HERE
@@Jemimakl WHY ARE YOU SO HARDWORKING
@@Jemimakl BRO YOU STARTED A WEEK AGO
Seline Chung I WAS DOING HOMEWORK
Perfectly explained ✨️
Could you please let me know, if the white centre line (the one around which all the ebsilon points are there) is itself not straight and showing a pattern ,what do we interpret? Does this mean that the mean of errors is non zero and hence our assumption is contradicted?
very clear explanation.
At 1:56 you can't plot against Y because there is dependence between Y and the residuals? You mean the residuals are the difference between the observed and the estimated, so makes no sense to plot against the observed? But why? Could you clarify this?
great video. such a clear explanation. subbed.
Prof, Could you do some videos on multiple linear regression? Hope you come back soon with new vids!
thank you for this amazing video!!!!!!
You're very welcome!
this really helps, thank you
perfect video
Very nice teaching. Thanks
These are very good videos
Hi Sir. May I know what statistical tests/treatments being used in residuals plots to confirm what is allowed and not? Thank you for your help.
Still extremely helpful in 2024
This is gold!
Great video! Thank you!
Very nicely explained 👍
Nice! The only improvement I would suggest is that you actually name the violated assumptions. I mean people can draw that conclusion on their own but that would make it even more clear.
thanks a lot your a king
my graph is blank, what does that mean?
Question: Why do you assume normally distributed errors? From my understanding, in large samples iid-errors with from any distribution should be sufficient (Central Limit Theorem).
I have a question regarding the Normal Q-Q plot. On the y-axes, does it show the quantiles of the residual distribution, or the residuals itself? On the x-axes it shows the quantiles of the residual distribution if it were normal, correct? Thank you, great video!
There are different ways of formatting these plots, but here I have the ordinary residuals on the y axis. (The y axis value for any point is the ordinary residual of that point.) Any value could be considered a quantile. The x axis represents the corresponding quantile from the standard normal distribution. So if the residuals were normally distributed, we'd expected those values to fall (roughly) in a linear pattern. (There are some technical issues here, as the observed residuals aren't technically iid normal, even if the OLS assumptions are true, but it's a rough approximation.)
Please can you share me a link with your video on how to correct the unequal change in variance problem shown on the plots. Thanks in advance
is it ok in linear regression if dependent and independent variable are not normally distributed if not what should be the optimum solution for negative skew and neg kurtosis
nice and clear
thankyou very much
3:23 what kind of graph indicates non normality?
Shouldn't we analyse the standardized residual plot? I mean, the residuals will be naturally bigger as the y value gets bigger, won't it? If the y range goes from 0,1 to 10 thousand, we expect bigger residual absolute values near the 10 thousand mark. Correct me if I'm wrong, please
If I can't find out if the variance is constant from the plot what should I do?
While interpreting the residual plots, can I first pool the residuals in specific bins of X (say each bin 1 unit long or whatever) , so that it looks more like the previous plot with residuals for a given value of X, enabling me to verify the homoscedasticity (and also normality somewhat) more clearly?
Edit: Q) You mentioned that one of the assumptions was that for a given value of X, the error terms are normally distributed with a constant variance sigma-squared (same for each X). Then at 5:50 you took all the residuals disregarding the value of X, and graphically checked it for normality using a Q-Q plot. Didn't you mention that the normality assumption was for errors for a given value of X? I am confused. pls help.
answer to edit: If we assume that sampling was completely random, then data from all treatments/groups/sub-populations/values of X were equally likely to be represented in your sample.In that case all the residuals can be clubbed together and checked for normality.It s same as checking for each treatment group.Note this applies only for the residuals, not the variables.
In regression we usually have predictor variables continuous. so it is impossible to check normality for each value of X. in case of ANOVA , the predictor is usually categorical and you can venture to check residual normality for each treatment group/category.Both ANOVA and Regression come under Generalized Linear Model(GLM), so the assumptions are the same but they play out differently.
Actually all assumptions are on the error terms.But since Residuals are an estimate on the error, we check for "good behavior" on the residuals. We have to make do with what we have(which is the residuals, the error is unknown)
this also follows from the assumption that error ~ i.i.d N(0,sigma^2). So all residuals(used in place of error as a good estimate) are identically distributed(same mean and variance) and are independent of X , implies you can't look at a set of residuals and figure out which value of X it came from. For all you know, they all could be from the same value of X or different values of X.Needless to say, they must be sourced from the same population, you can't club residuals from different populations/different predictor(s). So for checking normality of residuals, you can disregard value of X.This is not the case for Y (dependent variable).
Nice video.Thank you.
But it is just plotted between random part vs independent variable(x). What if we have multiple independent varibles ( say z,t,w etc.). Do we need to check for all those seperately by expecting very same variance again regardless of independent variable? (random vs z, random vs t , etc.) Or is it ok just plotting predicted-y vs random part?
So helpful! Thanks.
So I got the 4:12 graph how can I find out what kind of data I have?
Thanks! Helped a lot!
You are welcome!
I have one doubt, here we are talking about simple linear regression in all of these videos in playlist. So this assumptions are also true for linear regression, multiple regression and polynomial regression ? , and all of these theory of finding confidence interval and hypothesis testing at the end to find whether coefficients are statistically significant or not , are these methods also applied in any other linear regression ?
The general idea still holds, yes. The specific formulas for the standard errors, degrees of freedom, etc., will change when there is more than one predictor. And there are many subtleties when it comes to multiple regression, so it's best to learn all about MLR rather than think something like "well, it's just like simple linear regression but with more predictors." That said, yes, the general ideas port over from simple linear regression to multiple linear regression in a natural way. Polynomial regression is a type of multiple regression, so same idea there.
in 4:40 you said that there is another feature that we didn't included in our model. but it can also conclude that my model is not good, right?
Hi I have a question, let's say I built a model and the R2 value came out 70%
How do I make sure that is the maximum variance I can explain by looking at the residuals.
at 4:21 , can we determine which model will solve this issue based on just looking at this residual plot?
Brill video! If residuals appear to show an inverted U, how can I improve the model?
Great video. How is plot of e vs time and plot of e(t) vs e(t-1) different?
think you guys should get more views... may be there are not enough stats students in the country
@jbstatistics, thank you so much for helping me understand these plots! You are the best teacher:) I give you a big check mark for this video too. awesome explanation!
how to check the independence in the residual plot?
Would it be relevant to make residual plots if i want to check a categorical variable in a lineare regression ?
Yes, some types of residual plots are still informative for categorical explanatory variables. With a categorical variable, a check for linearity is not required, but residual plots can still help to check the normality and common variance assumptions.
Thank you
safe my day
Thank you!
You are very welcome!
+jbstatistics ऊघजेऐऊ
but why are we doing this, please explain ?
Please help: Do the residuals have a unit or are they unitless???
The residuals are the differences between the observed values of Y and the predicted values of Y. The units of both the observed and predicted values of Y are just the units of Y, and thus the units of the residuals are the units of Y.
@@jbstatistics Thanks a lot! Really helpful!!
No one people like data analytics
@4:40 why did you say the residuals are small then big then small..
don't you mean they're negative, positive.. since their magnitude is the same?
I think it's because "ε" is a random variable (as he mentioned it in previous videos), and should stay so. If they appear at time sections up and then a bunch of them down, that randomness breaks up, since when a whole of them are up you can forsee they'll be down next time (then where's the randomness?).
I think that if all are up the same amount they're down (as you see @4:40), then, would they still have a normal distribution? no, it would be just a straight line probability distribution, in which you know the moment you're up, next will be down, and so on.
This model assumed ε follows a normal distribution, which is reasonable, since in real life many events occur this way.
If they're are jumping up and down in clusters then we're not dealing any longer with this reasonable distribution. But of course, at the end he'd some way deal with this time effect he didn't know beforehand was causing this, maybe so as to normalize them, as they should be to fit the model🤔. I don't know yet how he tackles this problem. If I find about it I'll tell you.
Hope this reply was helpful.
Best regards.
I'm not sure how to get the Q-Q plot... can anyone explain?
It's almost always created using software. My intro to normal QQ plots is found here: czcams.com/video/X9_ISJ0YpGw/video.html
Thanks a lot!! Much appreciated
brilliant
Thanks!
Ver helpful
E X C E L L E N T
Thanks a lot
Is there a way to t test the residual plot?
What kind of test are you hoping to do? There isn't going to be an overall increasing or decreasing trend in the residuals in simple linear regression. There may be curvature, and we could test to see whether adding higher order terms (e.g. X^2) results in a significantly improved fit. Cheers.
Can you use the t statistic to test if H: E(e "hat"sub i)=0 vs. H: E(e"hat" sub i) not equal to zero. E being mean and e "hat" being error
Preston C No, we can't test that. The (observed) residuals always sum to 0 in simple linear regression. When we say the expectation of epsilon is 0 (at every X), we are in effect saying that E(Y|X) falls on the line beta_0 + beta_1X. Conceptually, we could have a different model where the expectation of epsilon was assumed to be 2 instead of 0. This would change very little, except that beta_0 in this model would be 2 less than beta_0 in our usual model. This would unnecessarily complicate things, so we define epsilon to be a random variable with a mean of 0. Cheers.
But if we tested to see if e_i=0 vs not equal to 0 and rejected the null hypothesis that e_i=0 wouldn't that indicate that the residuals did not sum to zero and our previous assumptions were false?
Preston C The observed residuals sum to 0. That is not an assumption, it is a consequence of the least squares fit. If we attempted to test the null hypothesis that the true mean residual is 0 with a t test, we would end up with a test statistic of 0 and a p-value of 1. So that wouldn't really be a test. If you're wondering about testing the null hypothesis that E(epsilon) = 0 at *any given value of X*, that's a bit of a different story. We do something along those lines when we carry out a lack-of-fit test. (This tests the null hypothesis that the means do indeed fall on a line. We can do this sort of thing when we have multiple observations at at least some of the X's.)
A GOOD GAIED Program
Probably a simple model for college students, not high school.
The "simple" in simple linear regression refers to there being only one predictor (one x), and not because it's simple or easy. It's just the well-established name of the model. Unlike many others, I don't use any clickbait words like "easy" or "simple".
@@jbstatistics Oh, I understand. Thanks.
Nothing he is explaining makes any sense.