How to Draw a Graph - WORKED EXAMPLE - GCSE Physics

Vložit
- čas přidán 9. 02. 2019
- This is another worked example of plotting data on a graph. This is a popular type of question for students to be asked and this one is specific to drawing a curved line of best fit with an anomaly.
The question is as follows:
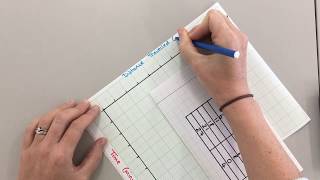
Plot the following data and draw an appropriate line of best fit.
Time (s): 0.20, 0.40, 0.60, 0.80, 1.00, 1.20
Distance (m): 0.52, 0.93, 1.21, 1.19, 1.56, 1.61
Thanks for watching,
Lewis
Relevant for GCSE Physics 9-1 in the following exam boards:
AQA (including Trilogy)
Edexcel
CCEA
OCR A
OCR B
WJEC
CIE (Cambridge International Examinations) IGCSE
Edexcel International IGCSE
_____________________________________
MY PHYSICS WEBSITES
Find even more videos organised by exam board and topic at:
GCSE Physics Online
► www.gcsephysicsonline.com
A Level Physics Online
► www.alevelphysicsonline.com
MY CZcams CHANNEL
Your support in watching this video has been invaluable! To contribute towards the free videos on CZcams, make a small donation at:
► www.paypal.me/physicsonline
FOLLOW ME
► czcams.com/users/physicsonline...
► / physicsonline
► / gcseandalevelphysicson...
#graphs #gcsephysics #physicsonline


Thank I used always lose marks on graphs
Bro, I have been searching for this on the whole Internet! Finally found it thank you so much 😫
I really appreciate your help thank you I always had difficulty setting scale for values of two decimal places
you've quite frankly saved my life sir thanks a bunch
thank you i need this for my revision
Perfectly explained ❤
Thank you so much!, you have really helped me ❤
Thanks dude❤️
Thank you 🙌🏾
Nice explanation
Thank you 🙏
Thank you 🙏🙏
Very helpful👍 thanks❤
thank you
Thank you
If you are going to speak or share knowledge. ,, can you speak slowly to enlighten the viewer about what you are saying this is just my opinion please don't be offended. ,, thank you
I hate to assume- but I don't think he likes criticism. You are right. But he seems to be either ignoring you or... just ignoring you idk
Bro how much slower do you want him to speak😂
I kinda agree with you he didn’t share how to set your scale and plot your points neither did he share the title, the title of x and y axis, but he is speaking pretty clearly to me so idk what your on about
I like it magnificent
How to plot 1.22 between 1 and 1.5
will he say in the question if it is a curve of best fit or straight line of nest fit?
Thank you lods
Thanks cro
Thx, i lost 3 marks last time.
I'm indian and i understand completely
Thanks
ofc. Ur indian use a smart at everything
Wait I'm confused now :(( my exam is tomorrow (paper 6) How is the line of best fit curved? Isn't it supposed to be a straight line from the origin? :o
I thought the same thing too
No it has to be a curved line because it does fit the graph and go through most of the points that you plot :)
Depends on the correlation of the points like @Hiam said
What is the scale?
Sijaelewa
Nyç
I thought one needs a ruler to connect the dots.
🌼😅 wow
thx
Hi there, won't we need a title.
Not needed!
@@PhysicsOnline OK.