How to use the Google Geocoding API in Power BI | Quickly find Longitude and Latitude Coordinates

Vložit
- čas přidán 8. 07. 2024
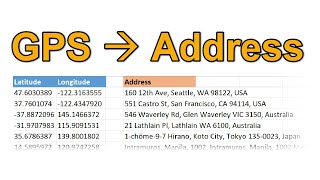
- In this video I show you how to get the latitude and longitude coordinates for locations in Power BI (and also the reverse). I create a reusable custom function in Power Query (M) and call the Google Geocoding API to find the location information. You will learn about APIs, custom functions, and M - and believe me it is less intimidating than it might sound like.
Enjoy this video and subscribe to always stay updated on my favorite Power BI tricks :)
Download file here datatraining.io/powerbi-how-to
--------------------------------
📊 TRAININGS 📊
---------------------------------
Power BI Design 4 Weeks Transformation Program my.datatraining.io/pages/powe...
Power BI Essentials datatraining.io/powerbilearni...
Business User Training datatraining.io/powerbi-busin...
For Custom Trainings and Consulting email directly support@datatraining.io
---------------------------------
⏱️ TIMESTAMPS ⏱️
---------------------------------
00:00 Intro
00:36 Finding latitude and longitude coordinates manually
01:03 Getting started with the Google Geocoding API
04:12 Connecting to the API in Power BI
06:25 Creating the Custom M Function for Geocoding
10:07 Dealing with multiple results for one location
12:03 Finding addresses for latitude and longitude coordinates
18:29 End
---------------------------------
😍 JOIN 😍
----------------------------------
Join bit.ly/4b453bi
Subscribe bit.ly/31MnQGO
Insta / howtopowerbi
LinkedIn / basdohmen
TikTok / how.to.power.bi
X / howtopowerbi
fb / howtopowerbi
Threads www.threads.net/@howtopowerbi
Newsletter datatraining.io/newsletter
---------------------------------
👇 CHECK THIS OUT! 👇
---------------------------------
💻 My gear amzn.to/47F21Yc
📚 Power BI books MUST READ! amzn.to/3tUfFcj
💡 General books I recommend amzn.to/48YNo33
🎶 Music for my videos www.epidemicsound.com/referra...
🚀 For growing on CZcams: www.tubebuddy.com/bas
🏄 Stuff I use daily amzn.to/3HqfMQ2
* Above are affiliate links, which means at no additional cost to you, if you make a purchase using these links we will receive a small commission. It supports us and helps us to continue making more How to Power BI videos!
Thanks for being a part of this channel and all your support! 💪 🙏
#HowToPowerBI #PowerBI #DataTraining
#powerbidesktop #powerbitraining #powerbideveloper #DAX - Věda a technologie


You're brilliant. I followed your steps, but had to tweak a few things. The good news is that I got the Latitude and Longitude for over 2,000 records. This saved me a ton of time. 🙂
Indeed this is very useful. Both in terms of geo coordinate solution and Power Query learning as well.
You are making Power BI beautiful with every such content here. God Bless you, Bass!
You are a genius!
You are great. I should say this video saved weeks for me. Thank you so much.
Dude, your are AWESOME! Super helpful, you have taught me alot. TY Sir
Excellent! Very well explained. Thank You!
awesome , it will help me a lot in the next dashboard of mine which is about flight timings , thanks a lot BAS
great walkthrough as usual
Gracias, Gracias, Gracias!!!! Excelente... Seguí cada paso y logre hacerlo con 1200 datos de prueba, necesito hacercon con 160.000... Congratulation
genial, feliz de escuchar eso - gracias por ver martin
Thank you!
Very very useful! Great material. Thanks..
Great Material Gman..
made my day, thank you!
Thank you so much for the video, it helped me a lot
Excellent explanation! Great Work!
Great content Bas!
Thanks! This is really amazing how easily you explained it!
thank you so much for supporting the channel!!! 😊 I'm very glad to hear it helped
Great clip, it helped me a lot. Thank you Bass!
;) awesome 😎 Janiszeh!
Brilliant man!
thanks for watching ! ☺😀
GOLD!
Thank you for your content and your easy-to-follow instructions! I saw your video on the quadrant chart as was enlightened by your use of x and y axis lines. I have a scatter plot that shows my approved exposure on the x axis and my actual exposure on the y axis for multiple borrowers. When the actual exposure exceeds the approved exposure, that is not good. I want to put a diagonal line in the scatterplot so that I clearly show all instances where the actual exposure is greater than the approved exposure. (Note: I am already using colors to delineate another variable.) Can you show how to do this?
great! thanks
:)
Thank you! Great video. I have a question, can it work with Zip codes too?
Would love if you would do the same type of video with the Bing Maps API key.
Awesome tut thanks. I'm running into some problems on a reverse lookup with the plus_code not always being there which I'm trying to figure out a solution to somewhere between power bi and Jupyter - how would you handle errors being returned from the geocode api here?
I have work orders on an airport. There are no physical addresses so it would be nice to click on a GE location on a tablet that will enter a GPS location (lat/long) in PowerBi map. Store it until a work order is done.
great content. What would you suggest if have thousands of coordinates in this format: 11.11111°N, 11.11111°W? As it will give error in returning address in that format
How can I do this but with local business names instead of city names? Great video bro.
Thank you for the excellent content. Is there a way to access the API only when necessary? Consider a scenario where I'm adding new customers to my table, and I don't want to geocode the addresses that have already been processed. The issue I'm facing is that every time I update my table in Power Query or load it into Power BI, the engine attempts to access the Maps API. This can be both costly and time-consuming
Hi - love your stuff. In this I can't find the download - I registered, got access to all the "How to Power BI" vids and links, but this one is not there (yet?).
I'll try later.
Hi, Thank u for this video
I have a question there is some calculation for the distance between two cities by using these steps behind
This is very usefull thanks. Is there a similar one to use google maps to calculate distance between two post codes, using long and lat, but not as accurate as google directions
Is it possible to look for a property address on powerbi and use the Google maps api to plot it. Thanks for the tutorial. 😀
Hi Bas.........i am having data for lat and long. I want to make clustering of that lat and long if am doing zoom in and zoom out in PowerBI Map visual. How can we achieve this? Kindly Advice
How do you hide those 3 options incl the three dot ellipsis when hovering a dashboard on some visuals like card, slicers, textbox, tables, etc. Are there any fancy or creative way of hiding those settings?
You can select the particular visual and turnoff visual headers in settings of that visual but it will only reflect while on PBI service and not on PBI desktop.
What if we want to have a fuction that takes 2 variables (from diferent tables)?
That's really great Bas. I could retrieve the data from API, but when I finally try to apply the modifications I've got the following message:
OLE DB or ODBC error: [Expression.Error] We cannot convert the value null to type Text
Indeed there are a few data that are returning "null" values. What should I do ? Thanks in advance!
I am also running into the same issue with the "null" values. How can we bypass?
There is a tutoriel about google maps visual in power bi
Is it possible to put a Google Earth visualization in Power BI?
Great video. Is there any way to limit the Google API call to only update for new addresses? Currently when I refresh the database it calls the API for all addresses, which 1- takes long and 2- uses credits each refresh. Please help! :) And thanks again
hello Johann! did you get a reply somewhere else for this question? I have the same problem
what should we do to avoid extra charges as a single row is giving one request I have 23,000 rows so I will have 23,000 requests should I cancel my refresh for this report for just the api maybe I wil refresh once every 6 months
hello @amarkhaliq5020 did you find the solution for your problem? because im facing the same the issue. it is sending atleast 2000 request whenever i press refresh
@@ahmadbutt1472 no I haven't, I just stopped as I was only trying out the google api for learning purposes.
hi, Could you make a video how to connect the power bi to a kmz source where this data source contains several cities with their latitudes and longitudes? It is possible? Rugs,
at 5:53 I am getting two rows instead of one please help
What will happen if I refresh the dataset on service. Will the charges apply again every time I refresh? What will happen if the data set is in direct query mode and not import mode
Yes!
Can you do it with the POBox address, please?
would be the same
no free?
SHOW SHOW SHOW