Best explanation ever! I've looked at multiple descriptions over the last 4 to 5 years, and I was always failed to grasp the concepts completely. I can stop looking for answers now. You have clarified these ideas beautifully. Thank you!
I knew from first few words spoken in your articulate and careful manner that your explanation would be worth listening, and I listened and benefited. Thank you very much. Great teaching skills.
Thank you very much, I had taken 3 courses of epidemiology and this the first time I understand very well the tradeoff btw sensitivity and specificity, thank you again. God bless you!
Best explanation of the medical sensitivity/specificity lingo in terms of the underlying signal detection theory of Green & Swets. I wish they would just use the original labels of hits, misses, correct rejections, and false alarms for the regions, and d' and beta for the test characteristics.
While almost any online lesson/lecture made by indian people is top notch, it's often buried under thick illegible accent. Your voice is crisp and you've found an efficient way to explain this. Thank you.
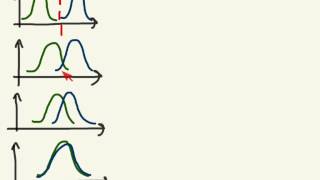
Hi, I am confused about the cutoff point for most of the true positives, the highest positive predictive value, the lowest negative predictive value and the highest specificity on graph. At what point, I get most of the true positives and at what point I get the highest specificity. I hope someone clarifies these. I would be much more appreciated.
Those depend on the prevalence of disease, which isn't really depicted in these histograms. I did go over that in this video, though: EBM: predictive values
Hi, i have a problem understanding the following statements, usually thrown in the context of specificity and sensitivity: A highly specific test is good for ruling in disease if positive A highly sensitive test is good for ruling out disease if negative Isnt the first statement the definition of "PPV" while the second statement is "NPV"? How do we make sense of that? Is it necessary that a highly specific test would also have a high PPV, while a highly sensitive test would have a high NPV?


You achieved in 12 minutes what my lecturer couldn't achieve in 3 lectures, thank you :)
Same
same here. i had two lectures over that.
3 lectures LMAO mad
Best explanation ever! I've looked at multiple descriptions over the last 4 to 5 years, and I was always failed to grasp the concepts completely. I can stop looking for answers now. You have clarified these ideas beautifully. Thank you!
Its 2018, and this video is still making an impact!! Thank you so much!!!
@@lekhar5164 2025 now.
I knew from first few words spoken in your articulate and careful manner that your explanation would be worth listening, and I listened and benefited. Thank you very much. Great teaching skills.
Fabulous lecture! Thank you so much! The visuals you learned to explain this did so much more than any 2x2 table I have ever seen.
Thank you very much, I had taken 3 courses of epidemiology and this the first time I understand very well the tradeoff btw sensitivity and specificity, thank you again. God bless you!
this binary category is actually so easy to understand. Thank you for explaining it in such a way, Rahul!
Very well done! I sense it clearly now about the importance of the tradeoff! Thanks.
This was a great explanation - a perfect crash course for review. Thank you!
Perfectly put! Very clear and concise. Thank you!
this is a truly GREAT and CLEAR explanation !! thank you so much
You have done a great job.
Greatful to find you.
What a superb explanation!
Great job! Very helpful and clear.
Awsome. I finally understand since you do understand what you are talking about. Thanks a lot
The phd students in a fancy business school really appreciate you, Rahul. Thank you!
Great choice of examples !!
Very beautifully explained with great visuals! Thanks Dr. Patwari.
Rahul , You have made it easy to understand ROC curves. Have followed your videos wheneverI need to understand basics
Thank you so much for this perfectly done video!
Fantastic video. Thank you.
excellent video... clear voice..must watch video
That was a great explanation. Thank you!
Excellent explanation. Thank you so much!
Thank you Rahul, bliss you
May God give you Paradise :-)
2019 and thankful to you. Hope you have a great day!
Excellent ! Much better than my professor.
I wish my prof had explained it this way. I really like this.
very good explanation .. I'm specialist and I like how you present this!
Best explanation of the medical sensitivity/specificity lingo in terms of the underlying signal detection theory of Green & Swets. I wish they would just use the original labels of hits, misses, correct rejections, and false alarms for the regions, and d' and beta for the test characteristics.
Brilliant explanation, thank you!
Thank you, this helped me a lot! Very good teaching
Absolutely amazing! Thanks a lot!
don't think I will ever forget this again! thanks man.. subbed!
Thank you so much for the clear explanation Mr. Rahul!
You safe my life. Thank you sir!
excellent presentation. Nice and slow, and very clear
Oh... Thank you so much! Why are other people not able to explain it in such a way like you. LOVE YOU ;-)
Amazing! nice explanation! Thanks.
That's just awesome!!
Thank you so much ✨
Great lecture! Thank you!
Amazing presentation of the content!
Great explanation. Thank you.
Thank you for your great explanation
Thank you! So easy to understand!
Thanks to your explanation I got it! Blessings Mr Patwari ;)
GREATE Lecture in just 12 min!!!!
Best explanation. Very intuitive.
Great video. Just has everything right.
Thank you. I am going to use your graphs in a lecture (with proper reference to your video). Great work
Thanks a lot for the explanation!
You explained very neatly. If you have time please put more. Thank you
Amazing explanation
Thank youuu:))
WE NEED MORE TEACHERS LIKE YOU,SUPERB
BLESS YOU, OH KIND SIR! MAY YOU ALWAYS BE UNDER GOD'S PROTECTION!
Thank you so much for the video.
While almost any online lesson/lecture made by indian people is top notch, it's often buried under thick illegible accent. Your voice is crisp and you've found an efficient way to explain this. Thank you.
ironic that you typed illegible while meaning unintelligible in a comment critiquing others' use of the English language
Excellent demonstration
those who teach simply actually know the concept ...u proved u 👏
amazing explaination that i am looking for
i finally understand it!, thank you very much!
Insane video. Thank you so much!
tussi great ho paaji....thanks for the video
man that was so helpful. thank you so much
nice explanation of the trade-off!
So helpful! thanks!
so clearly explained!
30 fucking years to find this. At last.
Excellent. really really excellent.
Great explanation
Great explanation.
OUTSTANDING, RAHUL!!!!!
what the hell is this AWESOME lecture !
thanx
WOW GREAT EXPLANATION
this is brilliant thank you
this is so helpful thank you so much!!!!
Great stuff!
AMAZING VIDEO!!! THANK YOU SO MUCH!!!
Thank you soooo much!
So useful! thank u!
thank you !wonderful explanation.can I please ask how do we decide a cut off/ classification algorithm for a given dataset ?
thank u for making my life so easy
thanks dude, good work!
Thank uuuu great job
Thank you...!
You are a legend
Thank you 😀
You rock!
amazing Thank you.... better lecture than Kaplan Biostats
THANK YOU!!!
?? thank you , but I want to know if I put the threshold in the middle of overlap so the sens will equal the spec
very nice video!!
thank you
wow! bravo .I dont think there is any room for improvement .I hope , hope hope you have more videos on screening tests and biases as well.Lets see .
Hi, I am confused about the cutoff point for most of the true positives, the highest positive predictive value, the lowest negative predictive value and the highest specificity on graph. At what point, I get most of the true positives and at what point I get the highest specificity. I hope someone clarifies these. I would be much more appreciated.
Brilliant
great, thanks
cheers!
Thank you very much for the video... but what about Positive predictive value and negative predictive value variations?
Those depend on the prevalence of disease, which isn't really depicted in these histograms. I did go over that in this video, though: EBM: predictive values
Hi, i have a problem understanding the following statements, usually thrown in the context of specificity and sensitivity:
A highly specific test is good for ruling in disease if positive
A highly sensitive test is good for ruling out disease if negative
Isnt the first statement the definition of "PPV" while the second statement is "NPV"? How do we make sense of that? Is it necessary that a highly specific test would also have a high PPV, while a highly sensitive test would have a high NPV?
Thanx alot