Table slicers for advanced interactivity in Excel | Excel Off The Grid

Vložit
- čas přidán 2. 07. 2024
- ★ Want to automate Excel? Check out our training academy ★
exceloffthegrid.com/academy
★ Get the example file ★
exceloffthegrid.com/table-sli...
★ About this video ★
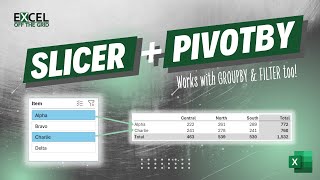
Having looked at how to use slicers with PIVOTBY and FILTER in the previous video.
Let's take this a step further and discover how we can use Table slicers for more advanced user interactivity:
- How to get slicer selections as a list
- Change filter context
- Create disconnected slicer tables
- Build a reusable LAMBDA function for slicer selections
0:00 Introduction
0:23 Data & creating slicers
1:00 Slicer selection formula
4:47 Changing filter context
6:14 Disconnected table slicers
7:37 fxSlicerSelection function
10:00 Conclusion
Previous slicer video: • Use slicers with PIVOT...
★ Download 30 most useful Excel VBA Macros ebook for FREE ★
exceloffthegrid.com/
★ Where to find Excel Off The Grid ★
Blog: exceloffthegrid.com
Twitter: / exceloffthegrid
#MsExcel


Absolutely efficient. Great field work. Thank you very much for sharing Mark.
Thanks Ivan. I hope you can put it to good use.
Stellar video! Thank you for sharing!
Thanks - glad you enjoyed it. 😁
Dark sorcery this is =) Thank you!
You're very welcome!
Hi Mark: A great video and terrific solution. This topic has been top of mind for me lately. Thank you! You're a great presenter -- clear and concise.
Thanks Jim - I hope you can put it to good use.
Fascinating. The only problem I find with LAMBDA and its help functions is how they make the formula almost unrecognisable from the original formula. My workaround, insert a couple of extra columns and break the formula down into parts to see how it changes. I also added some =FORMULATEXT cells to see at a glance how the formula changes. It works for me. Obviously, I downloaded your "...Complete" file and left it untouched to compare my WIP in the "...Start" file with the finished product. I'll need some practice.
Pre-LAMBDA adding columns to the data was pretty much the only way. That used to be my preferred method.
However, for me it broke the basic principles of separating data, calculation and presentation. It adds a calculation element (the slicer selection) back into the data (the table).
So I prefer the LAMBDA option, because I think it’s the right way to structure a spreadsheet.
@@ExcelOffTheGrid
It's just a temporary fix until I fully get my head around LAMBDA. Once I've practiced a few times, it will no longer be necessary. As I'm retired, it's not as though I'll need it for work or anything. I'm just doing these tutorials to keep my brain active in an attempt to keep the dreaded dementia at bay.
instead of filter, change the if statement to produce NA() then use the TOCOL() function to filter out the non-visible rows..
=TOCOL(UNIQUE(BYROW(Data[Date],LAMBDA(r,IF(SUBTOTAL(3,r),r,NA())))),3)
Tocol makes a easy filter to get rid of blanks and errors, so by putting the NA() function in the false of the if, is easier to do then the LET and Filter()
Nice, I like it ✅ - this might be the 6th method I’ve seen for this formula now.
Interresting use of TOCOL.
Maybe I need to do some performance testing.
Excellent post as usual, thank you.
Thank You. I'm glad it was useful.
Thankyou, this is very helpful
Awesome! 👍 I learned force row calculations using BYROW (), use LET (), and use IF inside LAMBDA.
Thanks! Been subscribed & followed
Awesome! Thank you! 👍
Very useful, thank you
Glad it was helpful!
Wow, amazing technique... 365 is now sorcery compared to older versions. It seems so much easier to ask the computer to do anything these days.
That's a good term... "365 is now sorcery"... it certainly feels like that. It gives us so many better ways to solve problems.
What I've used before is a helper pivot table (also connected to the slicer). This then shows just the selected items. Much, much simpler, so what am I missing??
There are always at least 3 ways of achieving equivalent results. Go for the solution you like the most. It is also always fun to learn new techniques to apply when you get stuck using the one you are used to performing.
I’ve used both methods too. The key differences are:
1) The Pivot Cache which the PivotTable is generated from does not exist in the calculation chain, so we need to rely on a refresh. This table method is more dynamic as it only requires the calculation chain.
2) A PivotTable is not an object we can reference directly. We have to reference a range which bigger than the PivotTable and hope it is big enough for the future. This method uses Tables which can be directly referenced and have auto expansion built-in.
3) By default PivotTables maintain a cache of previous field items, even if no longer I the data set, so may create the need to clear the cached items from time-to-time.
So, the PivotTable approach increases risk of error and the need for manual maintenance.
Once the fxSlicerSelection function set-up, I think it will be easier than building helper PivotTables.
@@maciejkopczynski55 Agreed. I did like and learn from the video. I just wanted to know if the technique in the video accomplishes something more than using a helper pivot table.
@@ExcelOffTheGrid Very clearly explained. Thanks very much.
Super👍❤
Thanks Kebin. 😁
I don't know what to say, wonderful video, 💞💞
I suggest that it would be better if you zoom little bit while working in a specific part of a screen like writing formulas , it helps to focus more , thank you 😊
Thanks for that feedback about the level of zoom. I appreciate it you letting me know.
👍❤
😁
once again - there is a much easier way to achieve your objective than all of these complications. Simplicity is key to success.
Also a small advice - before diving into function and formula - make the objective of the tutorial clear - for me it wasn't clear as to what was the objective of making this video. "Let", "Byrow","Lambda" - before using these like a recorded script - it is essential to explain what am I trying to achieve in the first place
What is the easier way that you mentioned?
@@ExcelOffTheGrid a pivot table(helper) or simple filter formula. I did this and got it very easily without complicating the objective
A helper PivotTable uses an object which is outside of the calculation chain. So it introduces 2 additional risk areas:
1) Having to reference an area bigger than the PivotTable in the hope the data doesn’t exceed the range. If it does it gives the wrong values.
2) Having to refresh the PivotTable.when data changes (which is de-risked if using Power Query) adds a manual step into the process. If a user forgets, the values are wrong.
The method in this video avoids both of those issues.
In the video we create a reusable formula which can be copy/pasted to another workbook. I believe that applying that formula is now significantly easier than having to create a helper PivotTable each time. Just my opinion.
@@ExcelOffTheGrid The amount of time and complexity involved in this is not the worth of yield in this case..just my opinion
Cool. Thanks for watching the video.
Hi,
Here's another way to get the selected items
=LET(rng,A2:A12,FILTER(rng,BYROW(rng,LAMBDA(a,SUBTOTAL(103,a)))))
That's nice.
I created about 4 different calculation for this... and I've created a better version in minutes. Good Work 👍
Thank you@@ExcelOffTheGrid