Make an Awesome Excel Dashboard in Just 15 Minutes

Vložit
- čas přidán 6. 06. 2024
- Build an awesome interactive Excel dashboard in just 15 minutes.
👉 Take our Excel for Business & Finance Course: www.careerprinciples.com/cour...
🚀 All our courses: www.careerprinciples.com/courses
🆓 DOWNLOAD Free Excel file for this video: view.flodesk.com/pages/63dd44...
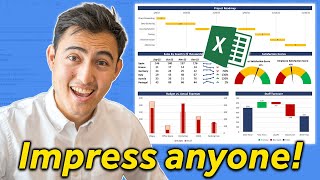
In this video we'll build a dynamic Excel dashboard from scratch in just 15 minutes. This will be a sales dashboard for McDonald's South America region. First, we'll make the dashboard dynamic using hyperlink to navigate to the different tabs. Then we'll build the overall structure using shapes and icons. Next we'll create all of the charts and visuals which include a map chart, radar chart, line chart, doughnut chart, KPIs, and more. Finally, we'll customize the visuals and add them to the dashboard.
LEARN:
📈 The Complete Finance & Valuation Course: www.careerprinciples.com/cour...
👉 Excel for Business & Finance Course: www.careerprinciples.com/cour...
🚀 All our courses: www.careerprinciples.com/courses
SOCIALS:
📸 Instagram - careerprinc...
🤳 TikTok - / career_principles
🧑💻 LinkedIn - / careerprinciples
▬▬▬▬▬▬▬▬▬▬▬▬▬▬▬▬▬▬▬▬▬▬▬▬▬▬▬▬▬▬▬▬▬▬▬▬▬▬▬▬
Chapters:
0:00 - Making the Dashboard dynamic
2:11 - Dashboard Structure
4:15 - Creating the charts and visuals
9:34 - Customising the visuals and putting it all together
Disclaimer: I may receive a small commission on some of the links provided at no extra cost to you.


👉 Take our Excel course: www.careerprinciples.com/courses/excel-for-business-finance
🚀 See all our courses: www.careerprinciples.com/courses
These are really good
I am very impressed by the quality of the content and especially by the consistency of the business model. I'm trying to create a business in the same niche in the French speaking world, but I'm struggling. I would have liked to have your support, advice, a youtube channel review or a website review to improve myself.
Thanks Kenji for this well done video. Your content is awesome, simple and to the point to understand from the rest. I love this one in particular
I absolutely love all the knowledge I'm getting from these videos. I never thought Excel could be so exciting!
Great explanations - you Sur are a very effective teacher. I'll check out your courses in the next few days. Thanks a lot!
Kenji makes it look so easy. I love how he explains everything.
Wow! This is best video on the topic I have see so far. Very minimalistic and visually appealing. Thank you so much for sharing.
Love watching your videos, Kenji. Great work!
Thank you for this video. Your explanations are carefully put together. Your design concepts are truly professional as well. I will checkout your courses for sure.
Really simple and clear. Thank you !!
That's amazing ! Lots of love and many many good wishes for you, Kenji . 💖💖
Awesome vid as always Kenji! Would love to see a Precedent Transactions Valuation video to complement the other relative valuation vids (Comps, etc) - thanks!
Hi Kenji, i have seen ur multiple videos and would like to appreciate your work and the major part that i like about you is very clean work You Present , as i have visited ur website too, for downloading excel file , it was super easy to download it and unlike other youtubers with their messy websites
Nothing makes me suffer from imposter syndrome more than watching these videos and seeing how quick and effortlessly you do all of this. So impressive.
Samedt 😂
They prbl did it 1000 times
So many Excel professionals obtained their skills by copy,paste
I’m here for this too lol
never stop learning new things :)
Fantastic content! Some of the best I've seen on YT! Thank you. 👍
I've watched dozens of dashboard videos, and this is definitely THE ONE! Thank you for this~
Subscribed. Now I have a go to channel for excel tutorials. Thank you! I am surprised how you made this look so easy. Great video! 😁
👍🏻
Really solid video, you made that look very easy. Thank you!
I learnt more in the first five minutes than I did in the last 6 months of using Excel, Thank you for the video!
Where do people get this data from?
As I wrote to you last month, I'm now enrolled in your Excel for Business course. I'm DK, enrolled on 02 Feb 2023. You can look me up in your database if you don't believe me. These video uploads have been instrumental in my decision. I'm very excited and looking forward to learning from you guys.
is there any information on the duration of the course in terms of the amount of time needed for completion?
@@slowmo8375 The course is designed for students to complete around 2 modules per week, for a total of 4-5 weeks until course completion. However, the course can be completed at your own pace (faster or slower) and you'll have unlimited access to the materials.
Thanks Kenji - Excellent and very useful video - I appreciate your time making it.
Awesome explaination, have jut watched 4 mins of your video and enjoyed the explaination. Thanks for upskilling us for free
Great video. I love this style of learning. I will definitely watch more videos on this channel
Incredible work and excellent pace of teaching. Thank you!
You make it look so simple! Thanks
Awesome videos Kenji! Thank you!
Simple to the point well done dude
Ask me how many videos I've watched to produce an Extraordinary dashboard without a difficult learning curve. You are an exceptional teacher. I'll keep attending class! Thank you for sharing your skills and knowledge.
Thank you for your lovely comment! Just trying to put together useful videos :)
These dashboards look so polished!!
Thank you!
Great video, I watched many times and got some cool ideas for my own charts, thanks a lot
This is beautiful, thanks for sharing!
You are an awesome person...your level of understanding and the ease with which you teach these concepts amazes me..I have learnt a lot from you videos and am very grateful..God bless you for all your efforts to help others....another grate video..
Thank you for the comment Hans! Made my day 😁
Kenjiiiii
This was awesome!
Thank you so much
Thank you for sharing your knowledge with the rest of us
Thank you for watching :)
Awesome Video, i like the calmness and steps
Your way is impressive!!! ..... I like all your videos and I really benefited from all the videos I have watched.
Excellent video. You explained things very well
Thanks Man!! Great Video!!!
Thanks Kenji :) It's much helpful!!
These videos teach me more than the classes I pay for
Fantastic, so effective!
Good day Kenji
I hope you are doing well Sir.
I really do love how simple you make excel look.
Could you please do a Risk Management dashboard.
Awesome Dashboard! You are a good teacher
Super useful dashboard creation steps.
Great info..many thanks 😊 🙏
Good, love it.
Will practice on it.
Good one Mr. Kenji... please bring more on this 🙂
Thanks mate!! Always awesome!!!
Appreciate it!
Amazing dashboards Kenji
First try..sucessfull. Thanks a lot Kenji
It was amazing! thank you
Awesome man!
Great video as always and well explained. I love excel and been looking at learning dashboards. How do you decide what visualisationsd to use...i mean deciding if something looks better in a bar chart and not a column chart. I am thinking of doing a dashboard on info of countries of the world but not sure what visualisations to use to make it look good
Hi, you will gradually get the purpose behind each visual used.
Other way, you can always learn for different visuals and their dataset usage from research. :)
Hey Kenji, Love the content! Can you please make a video on ratio analysis on excel?
You always rock !, bring once video on Financial Modelling.
This is simply amazing.
Hi Kenji, love your videos, u create awesome content. I got 2 questions. If i receive new figures into my data table, will the pivot tables automatically update, or do i have to refresh manually? Do u think its a good idea to keep all my pivot tables on the same sheet, or each one on a separate. Thank you in advance!
You can make it your choice brr
Great explanation Kenji.
Thanks, it’s very helpful
Thanks for your videos.
really impressive! 😀🤗
Great! Thank you !
excellent video Kenji
Thank you this is nice to learn
Extremely Useful
Thank you, looking for more power bi content
This is pretty cool 😊
Holy sweet good lord above this is gorgeous!!
Thank you from Houston, Texas!
thank you for watching! From London UK :)
Awesome videos!
Amazing material
Thank you for this great content. I’m building out some of these dashboards at work for our Finance department starting with our cell phone bill which will be updated monthly. Should I use excel or power BI?
U r the best thank u
Dude we need you doing this in Power BI!
Awesome!!
thanks brother !
Awesome stuff as usual Kenji - I followed one of your dashboard videos and built one that is great! I now ask as one of my slicers is Week 1, Week 2 etc, how do I stop Week 10 appearing between them?
you are awesome!!!
You are the best. I love you.
Awesome Short class
Just Awesome
Great explanation
This video really helped me. Thank you a lot! I just have one additional question. I want to viszualize one page of the sheet at a tv. Do you know which software I can use that it looks nice?
beautiful
That’s awesome
amazing
Excellent tutorial, thank you! Is there a chance these courses are on Udemy?
Pretty awesome. Your videos have helped a lot! Could you show us how to make a CRM using Excel?
Mate you can't this has no database this isn't app. Watching this stuff will just lead you down the garden path to things you want/need that this can''t do
thank you so much.
I was today years old when I realize you can dynamic reference a cell in the text box - wow!
I completed it (except the geographical area, cause my excel isn't showing that option) . Thank you so much .
thanks alots kenji
Sweeet color coded map 👍
Cheers!
Good guide
Hi Kenji, really great video.. impressive how you can all that easily together. Can you please make same Dashboard for Logistics and supply chain (container, ETA, dates, between arrival and dispatch... demurrage.. ) please
Yes, that would help me at my work
@@jennifergribbins4560 yes please
Thank you sir Kenji! This is great. Can this excel dashboard be uploaded in google sheet and would still work when shared with other users online?
Hello Kenji, appreciate the informative video. Can you please make same Dashboard for Logistics and supply chain (container, ETA, dates, between arrival and dispatch, sales, profit... demurrage.. ) much appreciated!
He just taught you, so why don't you make a video doing that?
Hi Kenji, how did you enter the data in that format? Multiple tables in the same spreadsheet
Great videos. Do you have free excel courses from start to finish for absolute Beginners?
Thank you, can you also tell how to express in the pie chart if the target has been reached and over 100%?
awesome