How To...Calculate the Confidence Interval for a Sample

Vložit
- čas přidán 7. 07. 2024
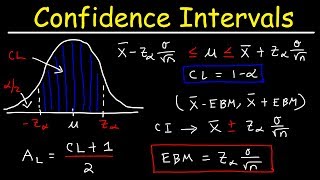
- Use Confidence Intervals to determine a best estimate of the range of a population mean based on the sample mean. A 95% Confidence Interval will be correct 95% of the time.


My teacher who was trying to teach us this content had over an hours' worth of content that still failed to accurately explain how to do this, your video was so much more helpful, thank you!
Don't underestimate that lecture, How many questions you can solve from 8 minutes of video as compared to 1hour long lecture?
Don't compare it just the way you focus.
Just learned a whole month of class in this video right here.
You really the man
its 1 week worth for my summer class.
Thank you so so so so so very much. I have been struggling with this for almost 2 hours. You made it so simple, and your video is so concise, yet so impactful.
fancy seeing you here. love you
same smh
I have been searching on how to solve this problem and you WERE able to break it down and i was able to follow without any problems. Thank you
So much clarity and such a easy way to teach. Appreciate your teaching style so much. Thank you for these videos. Love and respect from India 🤗
Thank you Dr. O'Loughlin! Wonderfully clear explanation.
Thank you. You manual calculation videos are really show the essence of statistics. I always use Minitab to analysis data, actually don't understand how to get the results. Your video helps a lot.
Thank you, Professor! You helped me out so much on this problem. Many thanks!
Thank you so much😭 I’m doing my assignment right now and couldn’t understand the teacher that was supposed to teach me this. Thank you for such clarity in how it’s done.
This video explained this very clearly and made it so much easier. Thank you so much. You're an excellent teacher
Thank you so much for your help. Im in the middle of confusion and some how your way of teaching, talking and interpreting make me feel safe and calm. Like everything all have its solution. I know its sound rediculous but thanks again.
your videos are always so straight to the point and helpful, thanks for everything you do.
You just explained it to me so that it “clicked” thank you for making this easy!!
I can’t believe I finally understand this, thank you so much!
THANK YOU SO MUCH!!!!! YOU JUST HELPED ME PASS MY FINAL!!!
Thank you, your videos are excellent, it makes so much difference when you work by hand and explain why and how.
This was soooo helpful! Thank you for posting it. I was so easy to follow
I had no clue on how to calculate this but after watching this video I can confidently say I will never fail this.
Your so cool, professor Eugene! love your teaching method, it's so easy to learn from you. Thank you so much. Respect.
Excellent, professionallly, absolutely clear. Thanks. Let Allah Bless you
thanks a lot I was struggling among many articles and stuff ..Bless you and healthy always
you're solid my guy
Beautiful and clean Eugene O'Loughlin. Wild how good that 6:58 min video was.
Thank you so much, professor!!!
The teaching is so clear and great. Thank you!
Your video was an excellent review - simple and succinct --- thank you!!!
I thank you for making it so easy to understand.
sir, you are a godsend. thank you so much for the informative but brief video!
One of the clearest explanation!
I've learnt about finding confidence level after watching your video.
This has been so confusing and you made it so easy. Thanks!
Thank you very much Professor Eugene!!
Thanks, professor! love the style and comes across easy to understand!
Your videos are so very helpful Thank you very much again!
Perfect explanation! Thank you so much
Fantastic teaching. Thank you
thank you. you explained it very simply...
I watch this always if i forgot how to calculate lol ty dude btw
YOU ARE AMAZING!!!!
thank you so so much
Thanks for help! This video helped me so much more than my professor!! Keep up the great work Sir 😀
Amazingly explained - Thank you!
Thanks very much sir. You just save my day. I have an exam to write in an hour time. Thumbs up for this video👍
OK it is in, Teacher Extraordinaire. Thank you for this.
This was very much helpful, thank you.❤️
you da goat
you explained it very clearly sir, thankyou!
Thanks alot you just helped me to answer my assignment questions 👏
this video REALLY helped thx
This video was so so helpful youre the best
That was very clear. Thank you.
Great video and came in right on time! Let me see if I can get the right answers now.
This is helpful . Thanks professor for this video . Comment is from Pakistan
great video and easy to follow!
thank you so much for the help friend
Genius! Thank you so much
You are the best professor
Thank you!
watching stationary calculations is so satisfactory :)
phenomenal
very useful, explained very well, thank you!!!!!
great narration thank you
Very clear explanation. Thanks
So concise.
great video!!!
Why'd you make it so easy, and why does my teacher make this so freakin hard
your voice reminds me of the youtuber great scott, good video though very easy to follow
I've seen other sources that state you can't estimate the mean with such a small sample size (n=14) unless you already know the original population data is normally distributed. That requirement was not mentioned anywhere in this video.
Isnt the t distribution for that? Wouldnt it be a z value for n>30 (im genuinely confused so pls weigh in lol)
@@diminarchy yes, that’s the exact reason why we use t-dist. We also don’t use T If we are given the population standard deviation.
WHOA! Thank You!
Thank you very much! Was very helpful.
Love you ❤
this is the best work❤
I'll try this today
Really helpful! How to calculate confidence intervals of variance (n under 30)?
I feel like I am not learning much in my current statistics class. CZcams has become my new professor and the only way I am understanding it which is sad. 😢
great video sir
you're doing god's work
very useful video, thank you very much indeed
Very helpful love from 🇵🇰
Very helpful, thank you so much.
Amazing!
Thanks man
Thank you Sir!
Bless you
very good job sir
what if your degrees of freedom is 199? how do we find the values there?
Thank you so much Sir
Thank you that was very clear. I am trying to understand what it means when someone says something like "that is one standard deviation out" when talking about outliers in a population. I heard it in relation to the distribution of IQ results and the challenges faced by people with an IQ at a certain (low) level?
Very useful sir❤
You save me❤😭
Simple and best
ty
Thank you so much
Thank you
Awesome
CZcams professors trump normal professors any day of the week, thank you for the great video
Compute for the minimum sample size using an appropriate formula. Assume that no similar study has been previously done and that the level of variability is unknown. Use 2% level of precision and 90% level of confidence. Could you please explain this to me sir!
Why do we indicate the t values on the curve? Shouldn't we be indicating the upper and lower limits (i.e. in this case 992.95 and 999.47) there instead?
what if it is not mean but a sample space, the sample space cannot be seen in degree of freedom. which is 47
very helpful!
good, so now i know how to calculate it, BUT why is it called confidence interval? it is just taking properties of my limited sample and multiplying it with bell curve properties to simulate that my data somehow magically is enough data so that i can reliably tell me by adding normal distribution properties mechanics, that it can tell me the chance that the populatin mean lies between these 2 values. sounds pretty daring. i have no clue yet ehy this works or should be true, and under which circumstances.