Create a Treemap

Vložit
- čas přidán 11. 09. 2024
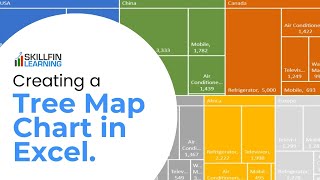
- What's a treemap chart? It's basically a way to see groupings of your data in a sort of hierarchy. You've probably seen this type of chart in online articles. It looks like a bunch of rectangles of various sizes enclosed in one big rectangle. Also there are different colors to differentiate the groups. Before Excel 2016 this was a difficult chart to make because you would have to manually calculate the dimensions relative of each element. With Excel 2016, it's just a couple mouse clicks and you've got a beautiful treemap. Check the video out to see how easy it is to do.
P.S. Feel free to provide a comment or share it with a friend!
#excel
#msexcel
#excel
#msexcelandtricks
#exceltutorial
#doughexcel
#excel101
---------------------
Excel Training:
www.exceltrain...
Excel Books:
www.amazon.com...
#excel
#msexcel
#doughexcel
~-~~-~~~-~~-~
Please watch: "Convert Table in a PDF File to Excel"
• Convert Table in a PDF...
~-~~-~~~-~~-~