Video není dostupné.
Omlouváme se.
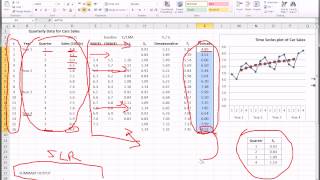
Excel - Time Series Forecasting - Part 1 of 3

Vložit
- čas přidán 17. 08. 2024
- Part 2: • Excel - Time Series Fo...
Part 3: • Excel - Time Series Fo...
This is Part 1 of a 3 part "Time Series Forecasting in Excel" video lecture. Be sure to watch Parts 2 and 3 upon completing Part 1. The links for 2 and 3 are in the video as well as above.
For SQL practice, you can go to www.stratascratch.com. They have over 500 SQL exercises and interview questions from real companies.
Their platform is free but you can use discount code jalayer for 15% off their premium features at platform.strat...


It has been almost 7 years since I graduated MBA classes, you know what, I desperately needed the time series forecasting which I learned back then. Thats exactly what I needed . I have recalled everything thanks to you. The explanation is easy to understand, and very clear.
Tansu "the bum with bad memory" Tazegul
Terrific! I just used the technique from these three videos on a real-world 4-year dataset related to Natural Disasters. The forecast was excellent; I compared the 5th year forecast versus a partial set of actual data from the 5th year, and it fit very nicely! Your explanation was very clear. Thank you so much for sharing this.
I disagree with Mr Ivan...... Whatever repetitions you have done not only clarified the subject more, but it also did a bit of revision. One should think about people who are totally alien to the subject , and not about those who know too much ABOUT THE SUBJECT ! I am compelled to say that that the author and commentator of this video is one of the greatest teachers EVER ! ( this is my first video for him, but I am a physician and I know how to evaluate something ! Congratulations to the Jalayer Academy and thanks for being kind to spend your time and money for the common and downtrodden man !
Searching for this content from last five years.
Thanks a lot.
6 years later, still helpful
I learned more with this three videos than with a bunch of books. Thank you very much!
Very good patates amb suc!!!
"Thank GOD 🙏🏾", and thank you very much for sharing your support and time 😉 That was REALLY Really really good 👍🏿 Long, but good...
This series of 3 is fantastic! Thanks so much. It's really straightforward to follow and does exactly what I need.
Just wanna say. May God Bless You! Amen!
Dear Jalayer, I would like to thank you for these productive videos. It exactly step by step which I benefit a lot and I appreciate your patience in doing the video, please keep up the great work.
Thank you so much for saving me. I have been struggling with this for a few weeks and this assignment is due on Monday. Until I found your video, I had no clue on how to do my assignment and I am grateful that you took time out to post this because I'm hoping that I can use your example to follow to do my assignment and pass my class. Forever thankful :).
Excellent tutorial, I am power Engineer and i have learned nice skills here... Bravo, get us more...
Excellent job describing how yo perform a time series analysis. A lot of views but not a lot of subscribers. Support this channel!
You have the knowledge and know how to teach. Great job and thanks a lot!
Hi Sir, I've similar inquiry as karadic; why the first value of MA(4) been placed at the 3rd quarter instead of 4th quarter?
You saved me bruh! I was struggling with no idea now i can copy paste this, Lifesaver
Awesome, one of the best explanation on Time Series using Excel, you made it look so simple...
The theory is sharp and precise and the examples are simply to the point. This 3 part video is easy to understand and practise. Highly recommend this time series tutorial
thanks for watching, and for the comment
@11:00 why do you take the MVA of 4 quarters and put it in the 3rd quarter location? so you have 2 from the past, 1 current, and the 1 of the future.
Did you get an answer to this ?
I also would like to know why he did this
@@evob20 at the end of the day it doesn't matter where he places it, it was just to show the average of all four within that quarter. He said it should really be in the middle but the next best visual idea was to put it in the 3rd cell going down. To clarify, the average is all four added together and divided by 4.
When we use odd no moving average say 3. We need to take the moving average only for 1time that means if we take three quarter moving average of 1,2 and 3 the answer which we get by averaging them needs to be place in the centre that is 2 . But in case of even moving average say 4(1,2,3&4) the centre is 2.5 and the centre for the next observation (2,3,4,5) is 3.5 , that's why we need to do moving average again for 1time by taking the value which we get in 2.5 and 3.5 .Now the centre of 2.5 and 3.5 is 3. Hopes this satisfy you
Awesome job, you saved me a lot of headaches! Thanks so much! You the man!
Great video. Pro tip: Set the playback speed to 1.5 😉
I did use the technique to forecast the rice of rice and gas over 20 years back data and get good result.
Thanks for the video! What types of forecasting is this, and why was it chosen compared to say, exponential smoothing / ARMA / Weighted moving average?
Great video ! cover fundamental of forecasting .
How to manage forecasting in excel , especially if products or sku is more than 5000.
Sorry, I have not made the Excel file available, you can pause and get the data, on HD setting hopefully, thanks for the comment
missing data is quite a challenging problem to have sometimes, there is a whole field of inquiry into how to handle this, you may have to look into missing data in time series, thanks for watching
many thanks to you for the comment
How can we use this in call centre where we have to forecast interval wise one hour interval..
It was very helpful.....I gone through all 3 videos.
Very well explained
Thanks you so much
It is extremely illustrative and helpful. Thank you very much
I built forecasting models based on this video.... THANK YOU SO MUCH
10 years later, using this for my assignment. Thank you
Thank you i learnt so much from the videos. I really don't know liked the teaching, tone and the pace is so good to understand easy in details explained you are a great teacher and a gift to the students 👌😀
Thankyou for the video. Really helped me to clear my understanding of time series forecasting.
Can you please make a video on how to use the column chart, pie chart, and doughnut cart in a perfect professional method?
glad I could help, thanks for your awesome comment
Extremely helpful! Thank you very much.
Explained with such simplicity and clarity,, Kudos :)
Pl explain why in MA not considered Year 1 Qtr 1,2 !!
Great video series. I have learned and applied in bussiness. I am looking forward to see the R version of the series.
Excellent! Made a very complicated subject easy to understand
Thank you very much. this is exactly the solution to the problem i was facing. Thanks for the step by step instructions.
Hi what version of Excel are you using? If I want to use the same for Excel for Mac please let me know which one to download
How to forecast for year 6 and 7 as well?
Sir. I am not getting this in your playlist. In which section have u added it. Plz let me know sir
Hello I just wanted to know how I should address the above if I have monthly data of last 2 yrs instead of quarterly.. plz help
May I know the theory and formulae behind this example. I mean what should I search for to get the theory
Thanks for the video. Just wanted to know if I have to do it for a year do I have to take a moving average of 12 months. If so wouldnt it lead to a lot of loss of data?
so how do account for the human element and market conditions?
If you want to do a 4 month moving average, you would have to start the formula at Year 2, Q1. This is a common mistake, but the moving average starts in the row immediately following the final baseline data point that the average uses.
J'adore votre vidéo! Merci beaucoup Monsieur Jalayer :) It really helps me
Great video. Could you also explain the Holt's winter multiplicative model in forecasting using excel? Also, some of the statistics like MAPE using excel?
Hi Jaylayer academy
I want to thank U a lot for vedio on time series in excel, is very helpful and more simpler to understand. Thanks for the great work. One more thing, do you also have vedio on ARIMA model with excel
Hello sir,can i know what method it is?? for example moving average,or exponential or ARIMA ..cause i want to find article about this kind of forcast..tq sory for disturb you
Awesome one. Made it completely clear. Thanks a lot sir
How to do this for yearly data? And will there be CMA in yearly data where MA taken is for 2 years?
Can u please tell me how to predict the month wise data using method. Can u please explain it by an example.....
Which forecasting technique would this be? Would it just be considered moving average?
This helped me a lot, i will be using it my final paper. Could you please tell me if there is any article where it explain the methodology or from with book you found it?
Thank you for the help
Thanks, I was looking for an excel version of time series.
Video really helped me very much thanks a ton can you help me with the predictions for hourly in a day
Do you have a video that discusses the benefit of daily weekly or monthly forecasting?
My chart is off. When I try to plot the CMA the values seem to double.In other words the actual values do not hug the actual ones as in the video.. Am I doing something wrong with the select data function?
@Jalayer Academy please tell us what model this is?
Very clear. Thank you. I cannot understand my professor at all. Also his examples are terrible and unclear.
Well done sir, and without the voodoo!😀
what if the data starts with quarter 3 of the year instead of quarter 1 like in video. Then is there anydifferent ?
thanks for you tutorial jalayer, i just want to know if that example makes up all the ARIMA process thanks again
Hey can I use this model to forecast exchange rates over 2 years or more? Thank you for the great content!
you're awesome at breaking things down and explaining. Thank you!
Thank you for breaking this down. VERY helpful.
Hello,
I have a forecasting case study to present at a job interview next week. Is there any way I could send it to you for help?
this is just awesome!!! helped me a lot in my work!!!
i paused on 16:59.. till now steps are ok to follow..the one thong i cant understand is the positionof the MA & CMA. To start with if we ask MA of 4 why to put it on 3rd cell? My logic would indicate to me to start at cell 4 in your sheet in actual cell E7...Can someone explain to me? Thank you
Do you have a tutorial about time series using R .. Thank you !
I have daily interest rates data of the past 2 years. I want to forecast the daily interest rates for the next 1 year. I don't see any definite trend or seasonality, Can it still be forecasted? Also, what should be my moving average period?
This what I needed. Great explanation. Thanks a lot
Have you done any videos for the additive (rather than multiplicative) method?
I'm pretty sure I'm following this, but is it fair to say that your CMA is now an average of 5 periods, and not 4 by averaging the 2 periods of 4, essentially 5 periods fall into those 2 of 4, which gives the 3rd period as the center, correct?
Interestingly if you use a simple average growth extrapolation method you arrive at identical forecasts in under 5 minutes without carrying out all this detail.
I'm not sure if that's just a special case with this example but its kind of disconcerting that maybe a lot of this detail is not necessarily getting you a more accurate forecast compared to a simple rule of thumb method?
How to forecast the data if we wants to forecast data of every day or every week? Where MA and CMA should be taken as the in a week five daya are working, is it should be in fourth row of MA and CMA
Is seasonality only applies if the time is set by year? is it still called seasonality if i just set my own example into per weeks but it doesn't reaches one year? thank you
Very well explained in a methodical fashion.
How do i do a weekly forecast for upcoming years with historical weekly data available for previous 2 years?
How do you do the moving average for 12 months for several years example 1990 -2025
Love the explanation of the center moving average and the calculation to correct it for even numbers. I personally think you'd have done better in a real world scenario to just drop down to 3 for the moving average to plot a longer line.
do you have a book explain about this? I have try as the same you, it is great. but I need the written explanation. thank you.
Hi whats the name of this forecasting method ?
The irregularity also referred to as "outliers"
thank you and I have one question. in this example if we want to sum of sales for each year, how we can do that in excel? I mean for example for yaer 1 and ...
Instead of computing the CMA, would it be feasible to regress instead?
Nice presentation!
if you have data of 2 years (like the above -car sales)is it accurate to make a precision for 5 months later?
thank you
Is it possible to calculate ARMA model using this?
Thanks.
hey,,@jalayer academy,,,,many thanks for this awesome methode forecast,,,but,,,,would you help me, how to forecast if yt is uneven database ex: sunday to saturday (7)...??,,,
Thanks a ton, it was really helpful, however have couple of questions.
1.I have 5 yrs mnth wise gold price data & so for 12 mnth how shud i take the moving avg for e.g. assume data is in C1:C12, so should I take the first average in D12 & drag all the way down?
2.I observed that there is no cyclic effect in the data, so can the above method be still used to go further with the analysis or is there any model that I should use?
I need to make a time series analysis on Gold prices &USD Exchnge rate
Thank you very much sir, your videos are thorough with proper explanations
Thank you for the videos! They are really useful!
May i kindly ask if there is any fast method to do forecast for 1'000 inventory part number (each PN based on 3 years historical data of itself)..?
Hey thank you , @jalayer academy , Can you please let how did you decide to do Moving average on 4 periods
4 periods is one year, the assumption is that the data is cyclic with period 1 year
if I have period and data but one month data is missing , how can I calculate data for the missing month ? which model I should use ?