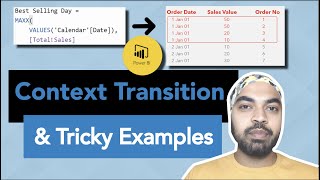
Bottom N Analysis in Power BI

Vložit
- čas přidán 2. 03. 2020
- In Power BI (DAX) there is no function as BOTTOMN() unlike it’s opposite TOPN(). In this video I’ll make an attempt to show you how can you still do a Bottom Anslysis, in other words anlayse data from least to most.
Blog Post - www.goodly.co.in/bottom-n-dax...
TOPN Analysis - www.goodly.co.in/top-selling-...
SUMX Video - • SUMX Function in DAX
- - - - My Courses - - - -
✔️ Mastering DAX in Power BI -
goodly.co.in/learn-dax-powerbi/
✔️ Power Query Course-
goodly.co.in/learn-power-query/
✔️ Master Excel Step by Step-
goodly.co.in/learn-excel/
✔️ Business Intelligence Dashboards-
goodly.co.in/learn-excel-dash...
- - - - Blog - - - -
www.goodly.co.in/blog - Věda a technologie


O my GOD! really ammmzed. Bring more CASE STUDIES like this please. Now DAX really make sense to me after watching this.
Excellently delivered. Many Thanks.
Thank you well explained, well done 👍
Wonderful video. Thank you for providing a very clear and well explained tutorial on how to use many DAX functions. You have a gift for teaching complicated topics in an easy to understand manner. Keep it going in 2021. Subscribed!
Glad it was helpful!
Great video. Thank you very much.
You packed so much in such a short amount of time as well as building up concept step by step Oh!. Your teaching methodology is superb. Thanks and Keep going bro.
Wonderful video
Thank you sir
Excellent. Just what I needed. Thanks so much. A great explanation.
Glad it was helpful! Cheers :)
You brilliant, brilliant man... thank you
Glad you think so!
very useful information. thank you
Glad you like it 💚
Brilliant! Your explanation is superb. Iterating over the variables with explanation saved me time to understand. Hooked to your channel already.Thank you
Glad you liked my work :)
Great Video. Question, would the code need adjusting to rank the largest negative movements in the quarter?
why am i getting duplicate values in the matrix when i use the exact same syntax you have used ?
At 3:37 , If you write = 2 in the Rankx funx, what If your data don't have a product with 0 sales, obviously your least Rank starts with 2nd rank right? Am I right..? Your Rankx works properly only if you have 0 sales product, right?
Very nice presentation of TOPN & RANK, question, when multiple items have the same lowest value / many products have blanks, but we'll like to show them as least selling, can we tweak this formula to calculate ranks for Blanks but still show only "N" results of those?
Good Question Sirisha,
Yes we can.. consider this measure
3 Least Selling Prod =
CONCATENATEX(
TOPN(
3,
FILTER(
Products,
VAR Ranked =
RANKX(
Products,
[Total Sales],,
ASC,
Dense
)
RETURN
Ranked >= 1 && Ranked
This was very helpful! Thank you...I discovered that getting bottom N values is possible with TOPN.
CALCULATE([Measure], TOPN(1, Table ,Table[Column] , ASC)) - this will return the lowest value:) If you add concatenatex you can return a list of lowest values
Totally forgot the ASC/DESC order despite using it many times. Good Catch. Thanks
How to get the worst selling day of each month.
Hi Chandeep,
could you Please
Make one video for Currency Conversion In Power bi Using DAX
worth watching...if possible can you please provide dataset so that we can practice
goodly.co.in/bottom-n-dax-power-bi/
Do a video about Pareto Chart?
We have 2000 shops/Branches have Loss/Profit of sales vary from -5000000 to 4500000. I want to show bottom Branches which contributes most damage/effect on Total Sales in FY
Thanks for sharing..Nice! Could you please provide a source file(Raw Data)?
Please download it from the link in the description
How to calculate the bottom / worst selling day of each month.