Decision Tree Regression Clearly Explained!

Vložit
- čas přidán 3. 02. 2021
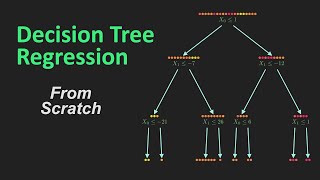
- Here, I've explained how to solve a regression problem using Decision Trees in great detail. You'll also learn the math behind splitting the nodes. The next video will show you how to code a decision tree regressor from scratch.
#machinelearning #datascience
For more videos please subscribe -
bit.ly/normalizedNERD
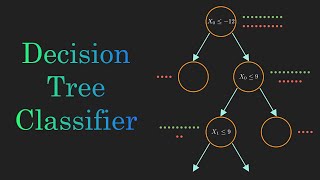
Decision Tree previous video -
• Decision Tree Classifi...
Love my work? Support me -
www.buymeacoffee.com/normaliz...
Join our discord -
/ discord
Facebook -
/ nerdywits
Instagram -
/ normalizednerd
Twitter -
/ normalized_nerd


Honestly this is the most high end professional video that's so simply explained! Amazing job!
It looks hard at first but with a good teacher explaining it really is so simple
Shout out to this dude for the awesome visualization and clearly explanation.
This video is next level teachning. Concept presented so clearly and so well. Thank you!
Thank you so much! Very simple and visual, that's all I needed!
Thanks for these visualizations! Helps a lot
your explanation is so far the best in youtube up till now. Dont know why the view number and likes counts not that high. But keep doing the great work !
that was quite understandable ! thanks for the good explanation and visualization!
Awesome visualization and explanation, I went through the Github implementation and it seems you are using unique feature values as possible thresholds. How this approach would work for a continuous feature with millions of records, as there will be many unique values to test.
Possible thresholds in the video were 1 and 2, right? Just checking my understanding.
Can you explain why X0
8:24 He explains that the algorithm compares every possible split and finds the one with the best variance reduction. So the y in X0
brooooooo this is brilliant, I can't resist myself from pressing the like button, it's such a blessing to have people like you
Great explanation! One question though is if the prediction is based on the average value of the target variable in the leaf node, it would mean that all the observations terminating at a node will have the same prediction. Is that right? For e.g., if 10 observations are terminating at a leaf node all will have the same predictions.
Great explanation! Just one doubt that in decision tree classifier we split the nodes until we get pure leaf nodes if hyperparameters are not clearly stated but in the case of regression problems how do it decide when to stop generating the tree if no hyperparameter is defined?
What a beautiful lecture..kudos to your efforts
Best explanation of decision tree for regression that I have come across
Awesome. May i know what kind of software you use for the visualization?
amazing man!! love your explanation and style
Excellent visualization, kudos!
So in love with your explanation sir, but im confused with the dataset, could u build a dataset in table, not graph?
Extremely helpful and easy to understand!
one hell of a explanation video. great!
Fabulous explanation sir! Thank you very much!!
In the ending example, the weighted average of variance used weights with denominators of 20 (i.e. 11/20, 9/20, etc.) . Has anyone ever thought to adjust these weights using Bessel's correction? Not sure how much of a difference that would make but just curious. I am guessing that the weights would be something like 10/19 and 8/19 with this adjustment.
Great explanation!
You already had 1 more subsciption, Superb explanation and visualization!
This is awesome! Clearly we use a binary tree to do the classification first (or build a decision tree first), and then we follow the tree to reach the target leaf node. Btw, which software do you use to make the animation? very impressive
Thanks! Well, I use Manim (a python library)
The nicest explanation video for DT on CZcams...
Thanks a lot bro. And your viz helped me explain my Model in the presentation. Carry on foreward
What a brilliant video!!
Quality content... I never seen before 💯
great presentation
I love all your videos.
Great explanation. Feels too simple to have looked up on video, which means it is explained very well.
Wonderful explanation
great explaination.thanks
How do you find the best root node. ? Coz in video it's about finding the best split which really helped.
But how to find the best root node???
Really good teaching.
Excellent video.. Thank you
Excellent!
Its good, can you provide the dataset used here
Great video. Keep up the good work!
Thanks!
Very good visualizations
I like it really, thanks
ur video is just awesome!
I am confused why you took x2
Really good explanation well done! Only one question, how do you calculate the wi weights?
The weights, I think, it's just a fraction of items for each side.
For example, 2 items on left and 6 items on right gives .25 and 0.75 weights respectively.
Thanks for the explanation!, I have a question... I watched in some videos that use MSE instead of variance, so Should I use the sum of squared error or variance? It'd be great of someone could clarify this please
MSE is used if both input and output is continuous ,variance is for discrete input n continuous output
Hi, great video! A small doubt, what does "desired depth" mean in decision tree regressor, does it mean that we reach a point where we can't split anymore, like variance becomes 0?
i think that's the depth of the tree you want, that you need to find by trying out yourself. you want to stop before variance becomes 0, as then the prediction really goes wild
Hi at 4:40 why did it go towards left node rather than the right coz x=16 and x
Thank you for sharing your knowledge. We appreciate it
Greetings from Argentina
You're most welcome...Keep supporting!
Man... Loved it..
Awesome!
Incredible 🔥
Thanks for the video! How do you decide x0
Actually, we try every possible value of the threshold and find which one produces the best split. If can go through the code for a better understanding. github.com/Suji04/ML_from_Scratch/blob/master/decision%20tree%20regression.ipynb
@@NormalizedNerd Thanks buddy :)
@@NormalizedNerd
you have done well but plz first explain taking an example by showing every steps from first to the last with every maths used and the computation on how we get the results and why this value and not the other etc.
plz teach like this so that every learner even the one who don't have basic can understand
it is a request
Hi, Though Var R1>Var R2, how do we conclude that R2 is best suited for split? Graphically I understand your logic as the colors are best segregated due to R1, we must choose R1, but I was unable to conclude the same from variance perspective. Could you please explain the same?
Do not confuse the variance reduction with the variance of each split. VarR1 < VarR2, hence the VarR1 split reduces more variance from the parent node (1 - VarR1 > 1 - Var2)
Awesome. Great video. Much appreciated if you could put the values or labels on the cartesian. TQ~
Suggestion noted...
this is excellent
Hi, may I ask 1 thing in minute 4:41, because x=16, so I think that condition is not true for x1
This condition is, indeed, true.
You may have confused x0 and x1:
x0 = 16 but x1 = -2. Here, we are talking about x1
Very Nice ty
bro you made it so easy
Sick vid! Did you use manim to make this video?
Yeah!
@@NormalizedNerd nice
Bro, you are better than krish naik lol. Thank you for the efforts. really appreciate it
Kindly make full course on fundamentals of machine learning as we are from not from computer science
incredible
Great video! Helping me a lot in preparing for my Data Science exam soon. One thing I did not quite understand yet is when I should use Decision Tree Classification or Regression? I understand that one uses Information Gain and the other Variance Reduction, but how do I know in the first place what to apply?
It depends on the problem you are trying to solve. As a thumb rule: if the target variable takes continuous values then go for regression and if it takes discrete (and few) values then go for classification.
@@NormalizedNerd I understand, thanks a lot :)
Great Expectations ✌️
Thanks!! More to come :)
How do you find the value of the inequalities for the filters?
By checking every possible value of a feature as the threshold and splitting the dataset based on that. Then taking that particular feature and the corresponding threshold that gives the maximum information gain. Please see the code provided in the next video for more clarity.
Can you add post prunning of the tree and visual representation of the tree please.I have an assignment 😭
hello people from the future! you nailed it here
Which values are -7 and -12 cannot be found on the grid.
You are awesome
Nice explanation, i was struggling a little bit to find some detailed material about this topic. As I thought, decision Trees in general always check for the best split looking for every possible feature, that means if there are k features and n samples, at each split the tree will perform O(m*k) variance computations, right?
It's not O(m*k) but exactly m*k computations at every split.
@@p337maB sure
One extra like for the classical music!!! 👏😀
😁❤
Thnx sir😊
Most welcome
you're the best, thank you Soooo much, india is the best
how did we get average
you have done well but plz first explain taking an example by showing every steps from first to the last with every maths used and the computation on how we get the results and why this value and not the other etc.
plz teach like this so that every learner even the one who don't have basic can understand
it is a request
cool
At 1.28, what you mentioned was misleading and could be misinterpreted. A line is still a line in 2D, a line will never be a plane in 2D. You should have said “or a plane in 3D”, or simply call it a hyperplane instead of a line or plane.
I actually came here to understand how we get the route note. anyone >?
Dada tumi bangali?😁
Ha bhai :))
@@NormalizedNerd bengoli accent ftw!
How are you determining the filter splits further down from the root of the tree? I don't see the reasoning that you're using to make this useful. I see the filtering, I see data points, but what is determining the other filters from the initial filter? Why is the partitioning valuable? How would the partitioning be applied? Why would you have two of the same filter between the two x variables, x sub 0 and x sub 1? Why is x sub zero represented in the root but not x sub 1? What is the relationship/difference between the two x variables? This looks initially useful, then it looks like a bunch of snow on a cathode.
"but what is determining the other filters from the initial filter?"
The initial filter (at root) divides the data into two sets. The left one is then again divided so is the right one. We do this process recursively. While splitting a set we choose the condition that maximizes variance reduction. Please see the implementation to get more clarity: czcams.com/video/P2ZB8c5Ha1Q/video.html
@@NormalizedNerd So are you saying that x sub 0 and x sub 1 are two sets of decision sets? Rather, two collections of boundaries? Something still looks off. If it's an array of decision boundaries, how do you jump from 1 (of x sub 0) to -7 and -12 (of x sub 1)? I've even tried to figure out the symmetry in the tree to find logic. 4 elements of x sub 1 3 elements of x sub 0. 20 partitions in the grid for 20 elements in the set. I've watched several of your videos trying to understand your message. Explain this one where it makes sense and I'll definitely continue to watch your other content. I try to give everybody that says they're providing "knowledge" a chance. This is outstandingly bonkers to me. I'm also a programmer and MBA
U spend a lot of time to make an animation
I am not sure if u should use MSE for every split
Bro… I would suggest you to get the proper knowledge when you start teaching any topic in machin learning, sometimes your statement is vague
Your so called autopilot ruined the video!