The ULTIMATE Slicer Panel in Power BI

Vložit
- čas přidán 7. 07. 2024
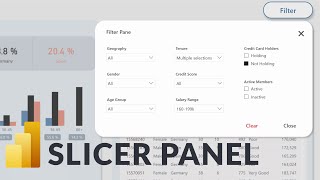
- In this video I walk you through how I would build the ultimate slicer panel. I show you how to integrate a bookmark navigator to deal with a large number of slicers and to bring structure. Then I have a closer look at how to visualise the applied filters and how we can highlight the slicers that have a filter in place.
Enjoy this video and subscribe to always stay updated on my favorite Power BI tricks :)
Download file here datatraining.io/powerbi-how-to
--------------------------------
📊 TRAININGS 📊
---------------------------------
Power BI Design 4 Weeks Transformation Program my.datatraining.io/pages/powe...
Power BI Essentials datatraining.io/powerbilearni...
Business User Training datatraining.io/powerbi-busin...
For Custom Trainings and Consulting email directly support@datatraining.io
---------------------------------
⏱️ TIMESTAMPS ⏱️
---------------------------------
00:00 Intro
01:23 Formatting and organising the slicer panel
04:00 Using the bookmark navigator to deal with many slicers
07:52 Showing which filters are applied - Option 1
13:10 Showing which filters are applied - Option 2
18:43 Adding a reset filters button
21:28 Improving the design
30:12 Creating an indicator for slicers with an applied filter
35:56 End
---------------------------------
😍 JOIN 😍
----------------------------------
Join bit.ly/4b453bi
Subscribe bit.ly/31MnQGO
Insta / howtopowerbi
LinkedIn / basdohmen
TikTok / how.to.power.bi
X / howtopowerbi
fb / howtopowerbi
Threads www.threads.net/@howtopowerbi
Newsletter datatraining.io/newsletter
---------------------------------
👇 CHECK THIS OUT! 👇
---------------------------------
💻 My gear amzn.to/47F21Yc
📚 Power BI books MUST READ! amzn.to/3tUfFcj
💡 General books I recommend amzn.to/48YNo33
🎶 Music for my videos www.epidemicsound.com/referra...
🚀 For growing on CZcams: www.tubebuddy.com/bas
🏄 Stuff I use daily amzn.to/3HqfMQ2
* Above are affiliate links, which means at no additional cost to you, if you make a purchase using these links we will receive a small commission. It supports us and helps us to continue making more How to Power BI videos!
Thanks for being a part of this channel and all your support! 💪 🙏
#HowToPowerBI #PowerBI #DataTraining
#powerbidesktop #powerbitraining #powerbideveloper #DAX - Věda a technologie


If you are interested in taking your Power BI Design Skills to the Next Level check out my 4 weeks program: my.datatraining.io/pages/powerbidesigntransformation
A bit too expensive for me 🥲but I'm sure its full of awesome content given your CZcams videos are already next level 🙇♂
This is so much fun and next level thing. You are the "Bear Grylls" of Power BI, the way you consume every possible features in it. I bet not even the developer team behind ever thought of these tricks.
Thanks Rajneesh :) this means a lot, very happy that you think its good 😊
I agree with you Raj
This guy deserves more subscribers than Netflix and Disney+ combined...
Great video Bas, continue spreading that wisdom!
Ohh :) this made my day thanks a lot!
so true. i am amazed
I love the way you acknowledge the (current) product shortcomings but find a way to work round it. Very creative!
Hey Richard, thanks a lot for this feedback, really appreciate it!
Love the solution to identify which filters are applied. That is such a clutch feature when you have a filter panel that is not visible by default. I was playing around with Option 2 a little bit, and I decided to go with something like this
ShowFilters3 =
"Filters (" &
IF (
ISFILTERED('Data'[Region]),
1, 0)
+
IF (
ISFILTERED('Data'[Property Type]),
1, 0
)
& ")"
If space is an issue, then dropping this measure as "Text" in a Button shows the user how many filters are applied, and they can click the button to show the Filter panel and make any changes.
Thanks as Ever Bas! I've only used the Dax Studio DumpFilters feature for de-bugging before as I found it too cumbersome to use in a report. However I hadn't thought of editing the text and only using the sections I needed to make it production friendly before! This is a great addiiton to my filter panel.
I also love how you purposely make common mistakes to re-inforce our learning. Like you did with the 'Data' Bookmark Setting. 👍👍👍
The world needs more content creators like you, thanks!
Just falling in love with all the manipulations and how ur fooling with the functionalities to bring the BEST of the BEST, just amazing, Brilliant! 💓💓💓💓💓
I watched the video and immediately implemented the idea in my Power BI report! Thank you!
Bas continues to produce the absolute best Power BI content, just can't get enough from it and I thought I knew what I was doing. Keep up the great work!
Thanks a lot, really appreciate it! 😎
FANTASTIC!!!! Thank you so much!!! I will definitely use this method going forward.
This is really high quality video about both design and filter context! As always, Good Job, Dear Bas!
Brilliant video thanks.
My company uses Qlik and Power BI and well, let's just say as the Power BI developer, being able to develop the filter pane in Power BI is nice.
I am looking forward to using Bas' ideas in my slicer panels. This is definitely how to make your slicer panels look sleek while using the space on your report page more efficiently.
Really Really well done! I am bingeing your videos! Love the easy to understand directions and your focus on things looking nice! Well done keep them coming!
Great video! You make it look so easy but it's a really clever solution. Thanks for sharing!
Thoroughly enjoy your knowledge and enthusiasm. Thank you for what you do! 🙏
:):) thank you very much!
Como sempre, só material top! Obrigado por compartilhar com a gente!
Thanks a lot Rodolfo
You made me in love with PBI Dashboard....Just amazing !!!!
U`re awesome with these quality videos that u`re still making weekly , love you job and Power Bi skills :D
Wow ! What a masterclass on this topic Bas, thanks a lot 🙏
Your approaches are brilliant! Thank you for your work.
thanks Paul for the kind words!
So much to learn just from one video
MUITO OBRIGADO por compartilhar seus conhecimentos.
Voce tem muitos fãs aqui no Brasil.
Venha ao Rio de Janeiro nos ensinar presencialmente. Será super bem vindo!
Aprendo bastante e sempre aplico nos dashs que crio.
Fraterno abraco,
Awesome! I learned lots of things. Thank you very much.
This is really amazing! I'm definitely using this on mi job. Thanks mate
BRILIANT!!!
This was really helpful! Thank you.
You are the best teacher 💫
Awesome! Keep up the good work!
This is awesome ........... your ideas are next level , I am improving day by day watching your videos' in terms of formatting.
Kudos for all your hard work dude !!!!
Very happy to hear this sarvesh! Thanks a lot!
Thank you for your effort, your work provides convenience in our business life, you are appreciated 👍👍👌👌
Thanks Ahmet! Good to hear you think so!
Amazing tips. Thank you very much.
Everything is so well thought out!
:) appreciate it Farhan
What inspires you? because these innovations are truly extraordinary
This is so helpful. I spent a couple of hours this week looking for a solution for many slicers and I still didn't have clear idea how to do that. And today you are coming up with this solution. Thank you so much 👌
Hi Pawel! That’s awesome! Super happy to hear it was helpful 😎 powodzenia! ;)
This is great stuff Bas. Your style of
explaining things is so easy for anyone to understand. 👍👍👍
🙏 thanks totally my aim: making Power BI easy and fun :)
@@HowtoPowerBI Mission accomplished!!!
It is amazing how much work you spend for one video. Great video and excellent inputs.
Right, takes a long time :) but worth it :)
This is really amazing Bas. Super helpful. Exactly what I need at the moment😆 .. you seem to read my mind a lot these days 😄😄😄 .. Thank you so much for sharing this.
You are welcome! Ah thats the voice i hear in my head then ;)
Definitely deserve many more likes and subscribers.
Awesome! I learned lots of things today. Thank you very much.
nice!!! happy to hear that 😎 thx for watching
I really enjoy all your videos, thanks for share your knowledge, greetings from Colombia!
Thanks Sebastian :) all the best from the Dutch guy in Germany
You Sir are just something else. I am mega impressed. As others said it - this is next level
Ah thank you so much for these kind words!
Nice! I'm always looking for better ways to deal with this. I'll be glad when either visibility or layer can be set in DAX. No reason to build bookmarks simply to show hide objects. Let me say on off or +1/-1 in layers.
You are great men! Every video is so fun and useful!
😎 thanks :):) super happy it is useful for you
Great material ...... lots of appreciation
Thank you Abdul! ☺
Love those infos!
Thank you!
Dank je, Bas
Amazing! Thank you so much, Bas!
Thnis Shakeel! :):)
The best channel! Thank you.
Thank you sooo much :)
Great Video as usual
Super underrated channel. Really love your videos
Thanks Angad:)
Thanks! I learned quite a bit from this video.
Glad to hear it James, thanks for your support:)
Eres un genio, Bas!
OMG! This is mind-blowing Bas.
Thanks for sharing :)
Glad you think so Vishal! 😎
Ultimate ...
Awsome
thank you Boss😊 I can Ultimate slicer! very good 🎉
Fantastic Mate, excited to watch these amazing tricks
Much appreciate your sharing :)
Thanks Norman :)
You sir, just earned a new sub! Your content is so good!
yey - thanks for the Sub!😊
Thank you. I'm just learning. I would love to know how to add columns and new calculations like how long something was there in days.
Fantastic!😲
Amazing.
Fantastic BAS, this is wonderful
Thanks Santhosh! Much appreciated
U r awesome man!
Good Job,
Thank you Very Very much
You are welcome :)
Simply the best with amazing tips.
:) thanks Rafael!
Great Video on Slicer's and very useful in Real time. Please let me know if you've any course on Data Science
Nice Hair Cut Bas! Thanks for the video :)
Oh wow thx for noticing :)
Thy, Bass! Great idea with headers
Thanks :):)
Another amazing video, like it
Thanks a lot
Classy, thanks 👍
glad you think so!!
Thank you Baas
Amazing video, do I need to create the bookmarks for each page? If I copy and Pasten in another page is not working anymore
wow, great!!!
thank you! ☺
Love the insights and creativity you provide! Thank you very much, you're a great inspiration!
One question though: with all the objects in the report just for the slicers (including the DAX behind it which is filtering over tables), when it comes to a larger data model, are there any performance differences - from the initial load to the response time on other visualizations in the page?
That's the question it comes to mind as soon as i see multiple objects in the report.
I wanted to ask the same question, maybe Bas should even make a video with explaining of possible performance issues.
Amazing How to video! Really helped me out clean up my dashboard which contained too much bookmarks...
Does unicode table site work? Can't seem to find it.... It's the last bit of the puzzle to ease down all the text
Mind blowing Baas!
Dag Bas, ik kijk met veel plezier naar je video's. Wat ben jij altijd vrolijk, zeg 😄Weet je ook hoe ik ervoor kan zorgen dat lege rijen worden verwijderd ondanks dat de datum in de eerste kolom staat? Ik wil de weekenden buiten de berekening van het gemiddelde houden.
Hi Bas, Thank you for the wonderful tips in the custom slicer contents, it is surely helping me in the report designing, But I did has a doubt regarding this, If I am using a text filter to filter my data will I be able to just show the text as the filter in the Filter Header section?
Wow 👌
Hey. I think if we use so many shapes for formatting purpose, this may slow down the entire report. If we create all those background shapes in Power point and save it as image and then import that in Power BI, it will reduce lots of visuals. In that way, we will still have all the lovely look and feel and performance will also be improved.
Definitely
Thank you for the Video. Has been really helpful.
But a quick question, I have created the slicer panel as you have created in the video, but the bookmarks don't work as I have created the same slicer panel for multiple pages. It would really nice, if you could give a solution.
Thanks!
Amazing Bas💥💯
Thx Pankaj!
OMG!!! Bass is genius
:)
Do you need to close brackets for RGBA at 31:44 ?
Great video! I like your style :-) I created an amazing slicer panel with your tips, but copying this one to all my other pages in the report seems not so easy:-(
Any tips on that?
Nice!
Thx!
What a great feature in a business who needs a lot of filters!
The only problem I am struggling with is how I can use this over multiple tabs? I need the same filters in other tabs as well. Do I need to construct the bookmarks in every new tab? That is now my solution, or can it be done with the options 'Data', 'Display', ''Current visual', etc?
And is it correct that if I do clear filters, I still stay in the selected filters (like 'Location')?
Extremely well explained
Hi Alex! Appreciate your feedback:)
Bas, thank you so much for what you do. I have learned so much about PBI design from you.
is your camera background a greenscreen ?
😃 awesome, great to hear that! Nope, no green screen
gold
Thx Romario!
I would like to know how can I add space between Coutry and City when I filter both??
As an idea, I love the videos and would be very useful to have the part where you show up explaining to be a smaller. I watch the videos at work and some collegues might think I am watching youtube for other things since you are showing up in most of the screen. Making it smaller would be better to not give others a bad impression. Thanks!!
thx for the feedback :) sticking with this format though
What would you need to change in the measures to get the filter table to work with a hierarchy based slicer?
What if you have so many more filters? Can you put them in a visual that allows scrolling down all those? Couldn't find anything on CZcams. Thanks
What if there's all visual filters applied and it appears on your "ShowFilters" and you don't want to? Great video, btw! Thanks for sharing.
Great video!!!
I am trying to get the Clear Filter button background to change color when filters are applied to indicate that is “active”. Have a measure that checks if filters are applied for each of the slicers and if so returns “yellow” if not returns gray. When I try to apply it as conditional formatting it does not allow me to select that measure. Any idea how to accomplish this?
Keep up the great work!!!
Hi, any hints how to make the "slider" type of slicer (single select) look better? the circle is to big and almost zero adjustment possible...
Is there a way to pass measure into a parameter for a dynamic query?