Linear mixed effects models

Vložit
- čas přidán 30. 06. 2024
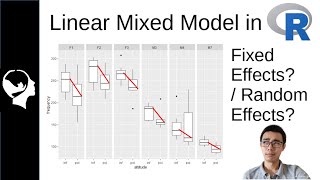
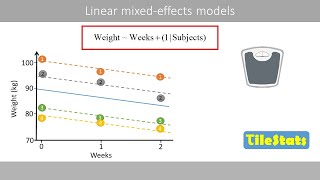
- When to choose mixed-effects models, how to determine fixed effects vs. random effects, and nested vs. crossed sampling designs. Requirements and assumptions of mixed-effects models, and how to evaluate them. How mixed-effects models can improve parameter estimation with partial pooling/shrinkage.
- Věda a technologie


Oh my goodness, thankyou for making a video that actually explains statistical content clearly! If I had a dollar for every video with a title like, "such and such analysis method, CLEARLY EXPLAINED!" then goes on to dive into the most complex content imaginable without proper explanation I'd be a very rich man. Sorry about this vent, I'm just very appreciative. Keep up the good work.
By far the best explanation on LMM. Thanks
Great explanation man, I really appreciate the effort! Although there is a lot of information available and also a lot of sources where to find them, it takes a lot of effort to explain these kind of models graphically. I've read about these models from 2 or 3 different sources in order to get a general picture, but this one is a nice and clear explanation, besides been shown as figures
Studying psychology and this was super helpful!! Thanks
I am new to this model and I have to say that this video is really helpful! Thanks!
this is the best explanation I saw so far! thank you so much!
This was incredibly helpful. Thank you!
Great video, thanks!! Just enough information to get me started without going into full-blown detail.
Thank you sir! Even with this simple explanation the topic is still complicated. I wished the examples were simpler.
Thanks Matthew. Very good explanation.
thank you so much! this is so helpful and you are great at explaining.
Really good explanation! Helping me write my first manuscript :)
The bext explanation I've found, thank you!
This was really helpful. Saved my day!!
Fantastic video! Thank you so much! You are the best!
thanks! very clear visualisations
this video is incredible, thank you so much!
Sir thank u so much 😊 best explanation period
Excellent work
Thanks Matthew. In a longitudinal design, let's say 5 Time Points, 20 subjects what would be the optimal way to set up the random effects? I feel like whenever I include the intercept or any interaction with tie TIME POINT factor it explains almost all variance in the dependent variable (as it changes from time point to time point, but I want to study the effects of the independent variables changing over time on the dependent variable).
Should I just ignore the TIME POINT (or "visit "1, 2, 3 4, 5) factor, as it's implicitly related to the values both in the dependent and independent variables? And just include the "SUBJECT" as a repeated measures account?
nice explanation. Thank you for posting. Can you share some materials on GLMM please? Thank you so much it really helps.
Great video
Great video. I have a question, what would make more sense to be used for accounting inherent agricultural field variability (having spatially separated block on a larger field)? A fixed or random effect?
Random
Thanks! Great explanation and summary. I wanted to ask if there's a source (paper, book, books) you could point to for this topic? Thanks again
Just to update anyone else who comes looking for a citation, the manuscript Naseem linked was recently published in Advances in Methods and Practices in Psychological Science! journals.sagepub.com/doi/10.1177/2515245920960351
SUPER nice!! one question, i have a LMM with df what do they mean?
The R code for all this stuff would be great
how is partial pooling or shrinkage model different then running a fixed effect model on that subset of observations?
Hello and thank you for the video
I would like to use GLMM multinomial logistic regression mixed model for repeated data with R software,
response ~ trt + period + seqTrt + (1|id)
do you know a package or a function for this model
thank you in advance
Country X has 30 states with repeated observation measures of X across 15 years for each state. Is Mixed Effects appropriate to model Y from X with states as random effects?
can I find somewhere examples of random coefficient models where the variable of the random coefficient is not continuous but categorical? ideally written with STATA or SPSS?
Great
if I have the more than 3 datasets with different x and y axis then how statistically it can be compared??
Can someone help me to do the plot where we visualize the lines with different intercept and slope? I'm using Rstudio
Awsome explanation. But wait, I just can't get p-values? How do I know which fixed effects are relevant?
It may depend on the program you're using, but the authors of the lmer function (lme4 package in R) chose not to give p values. However, there are standard errors for each coefficient and you can get the 95% confidence interval on each fixed effect by running the confint() function on the model output.
How can I write a comment on mixed linear model plz
Are LMM and LMEM the same thing?
how to add the fixed effect: shape, in the formula for nested random effect please?
it was great up until like 16:12 when suddenly randoms graphs from god knows where
can we make a collab video?
Did you get that collab?
6:45
Terrible explanation, just making a simple concept become ultra complex.