How to choose a scale on a graph (part 2, method applied to messier data) | A-Level Physics How To

Vložit
- čas přidán 12. 07. 2020
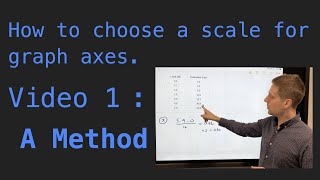
- Got some data to plot on a graph and need to plot it onto a graph grid? What scale are you going to choose for your axes? In this video I apply the method from video 1 to some messier data and verify that the plotted points cover more than half of the graph grid.
The data I use in this video comes from logarithmic calculations but you can still use the data for practice even if you are not familiar with log calculations since we are just fitting the numbers to the grid.
Plotting points to cover more than half of the graph grid is an important part of doing accurate graph work (i.e. calculating gradients and intercepts). I hope you find the method easy to use and helpful in all your graph work.
In the previous video ( • How to choose a scale ... ) I showed you the method applied. In this video I show the method applied to some messier data.
Relevant concepts: physics graphs, accurate graph work, picking a scale for axes, systematic values for graphs, maths skills in physics, maths for physics, maths hacks in physics.


Thank you very much Sir! I used this in my chemistry exam to find the scale for Arrhenius plot.
Wow! Simple, clear and clever. Thank you Sir
Thanks good teacher
Hi sir thnks for the videos , I have a question. Is the divisible by 10 step a fix thing i.e we always need to find value which is divisible by 10 ?
thank you
Great approach. Thanks
thanks sir
this was so helpful!
What to choose btw 0.06 and 0.1 plz tell
Hi how do you do this if you just have a full a4 sheet of graph paper
This helped a lot but I do have one question. Do we always divide by just 14 and 10 or does it depend?
How did u get 14
It is 0.0778 not 0.0777