The Bell Curve (Normal/Gaussian Distribution) Explained in One Minute: From Definition to Examples

Vložit
- čas přidán 27. 02. 2019
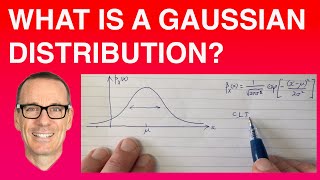
- If we measure people's height and display the results graphically, we'll notice that in most cases, we'll end up with something that looks like... you've guessed it, a bell.
The bell curve or Gaussian distribution is remarkably common when measuring anything from people's shoe size or even their IQ.
But what's the definition of the bell curve?
The term "Gaussian distribution" may sound misleadingly complicated at first, but fortunately, understanding the basics is not complicated at all.
I've explained the bell curve by, on the one hand, defining it and on the other hand, by illustrating everything through easy-to-understand Gaussian distribution examples.
After watching this video, you'll go from "kind of, sort of" knowing what this "Gauss curve thingy" is to meaningfully understanding Gaussian distribution.
Whether people refer to it as simply the bell curve or use the more sophisticated Gaussian distribution terminology, the bottom line is this: there's just no way to wrap your head around statistics without understanding the bell curve.
To support the channel, give me a minute (see what I did there?) of your time by visiting OneMinuteEconomics.com and reading my message.
Bitcoin donations can be sent to 1AFYgM8Cmiiu5HjcXaP5aS1fEBJ5n3VDck and PayPal donations to oneminuteeconomics@gmail.com, any and all support is greatly appreciated!
Oh and I've also started playing around with Patreon, my link is:
/ oneminuteeconomics
Interested in reading a good book?
My first book, Wealth Management 2.0 (through which I do my best to help people manage their wealth properly, whether we're talking about someone who has a huge amount of money at his disposal or someone who is still living paycheck to paycheck), can be bought using the links below:
Amazon - www.amazon.com/Wealth-Managem...
Barnes & Noble - www.barnesandnoble.com/w/wealt...
iBooks (Apple) - itun.es/us/wYSveb.l
Kobo - store.kobobooks.com/en-us/ebo...
My second book, the Wall Street Journal and USA Today bestseller The Age of Anomaly (through which I help people prepare for financial calamities and become more financially resilient in general), can be bought using the links below.
Amazon - www.amazon.com/Age-Anomaly-Sp...
Barnes & Noble - www.barnesandnoble.com/w/the-...
iBooks (Apple) - itunes.apple.com/us/book/age-...
Kobo - www.kobo.com/ww/en/ebook/the-...
Last but not least, if you'd like to follow me on social media, use one of the links below:
/ oneminuteeconomics
/ andreipolgar
/ andrei-polgar-9a11a561


GiganticWebsites.com is a project through which I make it possible for people to build truly gigantic websites (thousands of articles each!) at ridiculously low prices. If you have a great domain you want to turn into an amazing website or an existing site you'd like to upgrade/scale, visit our website or check out the One Minute Economics presentation video below:
czcams.com/video/gE8yEOQFMvo/video.html
Please note that this comment is not an ad for a third-party service provider. GiganticWebsites.com is my baby 100% and I will personally be involved in each and every project so as to ensure the website turns out great :)
What my professor's couldn't explaine in two months you did in 1 minute
Where you read
The Bell says it all, it really explains outcomes
well explained. thank you!
so nicely explained. thank you
You're more than welcome :)
so much insightful...
Thank You! mi amigo
Always a pleasure to hear that, you're more than welcome :)
Nicely explained!!👍👍
Glad you liked the video, thanks for the kind words :)
Wow so simple, thank you
Thank YOU for the kind words :)
Measured IQ scores follow the normal distribution *by definition*; thats just how IQ scores are defined and how IQ tests are created. There's not necessarily proof that intelligence (the rather abstract underlying concept) actually follows this distribution.
❤thank you. Amen.
Good explanation
Thanks a lot!
the smaller the curve means less extremes right?
and when applied to eugenics...
Ok thanks, but what’s the equation?
What if all are in the extreme? Like very high? What can be deduced from that.
If every data point is in the extreme, you can deduce that what you thought was "the extreme" is actually the average.
@@TheOiseau so my test or something is not testing what it should?
@@arminarlert1953 Maybe I'm not understanting your question. You asked what happens if ALL data are in the extreme (very high). Then it's not the extreme, it's the normal outcome. Like, if I expect human ages to have an average of 0.5, and I discover most people have ages like 25 and 42 and 68, I would reassess my hypothesis.
Show
0:52 "proverbial top of the bell" -- "Proverbial" is not a statistical concept or word to know. The narrator is simply referring to something that is 'well known, especially so as to be stereotypical' when he uses the word "proverbial." In other words, he's saying the "top of the bell" is something you may hear a lot about when studying and solving statistics.
One Minute Economics needs your help! Please give me a minute (heh) of your time by watching the following video if you find the channel useful, literally anyone can help (either financially or by spreading the word about my work): czcams.com/video/io04ckq1X1M/video.html
Well; 'explained', but not REALLY, because a LOT of crucial info is missing. Better to make it 2 or 3 minutes then.
Gaussian bell 😎
:)
4 year old video 76 thousand views and only 21 comments. I guess this bell curve thing is a bunch of bullshit. And I still have no explanation for it.
If you have a specific question, feel free to ask and I will try to answer. Or if I don't see it, maybe someone else will chime in through a comment so as to boost those numbers :D
it'd be nice if you can provide the sample data used in your eaxample@@OneMinuteEconomics