Analyze Stock Data with Microsoft Excel

Vložit
- čas přidán 3. 07. 2024
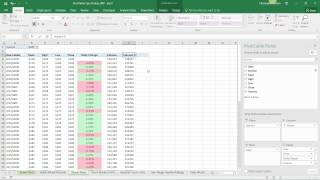
- Visualization of data is a powerful method to see trends and make decisions. Microsoft Excel trending capabilities are tools to visualize large data sets, such as financial information on company performance.
- Věda a technologie


Great video!
Excel is great at all sorts of data analysis!
true
Thanks for the video!
You're welcome!
good stuff!
Great video! Quick question, why didn't you use the stock history function to obtain the data?
That is a better way to obtain the data. Thanks for the tip. support.microsoft.com/en-us/office/stockhistory-function-1ac8b5b3-5f62-4d94-8ab8-7504ec7239a8
No need to normalise everytime you can record macro and execute for each selected stock by button click away
Hi! I've a question. When I open the file in Excel it won't split Date/Open and the other one to each individual block instead all goes in A1. What have I done wrong?
The data can be split into columns by selecting the column A and then select "Data" from the top menu and then "Text to Columns". It will give you a dialog box that will walk you through selecting the delimiters.
APMonitor.com Great! Can I do it with all rows at the same time?
Adam Magnusson, yes, just select the entire column.
It worked! Really appreciate your help!
What do the numbers in the volume column represent?
That is how many shares were bought or sold.
Many thanks, I've been looking for "stock market technical analysis" for a while now, and I think this has helped. You ever tried - Ganichael Yonharlotte Trick - (do a google search ) ? Ive heard some pretty good things about it and my mate got great success with it.
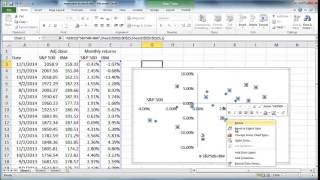
I did not get the Normalized part, would you please explain the reason? thank you
It is so we can compare relative (fractional) changes of the stocks.
deleted search history, deleted cookies, deleted download history, smart man.
How can i find a stock which is giving me consistent profit in which month where i have 20 years of data
Yahoo Finance and other APIs can provide data on stock performance.
@@apm i think he means to say past performance is no guarantee of future returns.
beat off once excel micre sheet iam enjoying wit programing systematic
I'm glad that you're enjoying it.
ADDO STA LU FILE
why are you normalizing the data?
+Ammar Ali Arif, normalizing isn't required but it does help to see fractional growth of a stock and compare the different growth profiles directly on the same plot.
@@apm I have a follow-up question to this. Your formula for normalization is x/xMax why use that versus (x-xMin)/(xMax-xMin)? would it even matter?
@@davecreighton1162 I like your normalization formula because it highlights the relative growth of the stock just in that time period. You may want to put an absolute value in the denominator as (x-xMin)/ABS(xMax-xMin) and perhaps protect in case a stock doesn't have variability during that time period as (x-xMin)/MAX(1e-4,ABS(xMax-xMin)) to avoid divide by zero.
APMonitor.com that's great! I'm trying to build an AI model for stocks in a class I'm taking and this video was really awesome!!
@@davecreighton1162 I'm glad it helped! Here is some additional information on Deep Learning with Python: apmonitor.com/do/index.php/Main/DeepLearning