Signal Analysis Made Easy

Vložit
- čas přidán 15. 07. 2024
- Learn how easy it is to perform Signal Analysis tasks in MATLAB. The presentation is geared towards users who want to analyze signal data regardless of their signal processing expertise. You will learn common signal analysis techniques such as visualizing and pre-processing the signal, filtering, identifying and measuring relevant features.
We will use signals from variety of application areas and demonstrate how to :
- Import and visualize signal data
- Pre-process and filter signals to enhance the quality of the signal
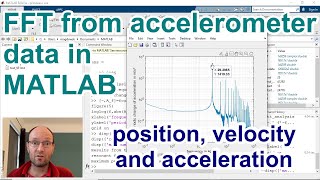
- Visualize the signal in time domain and frequency domains
- Analyze and measure trends, peaks, and other characteristic features of the signal
- Create a MATLAB app to package the analysis into a single file and distribute to others
Download a trial: goo.gl/PSa78r
See what's new in the latest release of MATLAB and Simulink: goo.gl/3MdQK1 - Věda a technologie


Thank you so much for the information!
I agree with following two comments:
"why didn't you describe the functions you used?? how we can understand?"
"This is quite pointless without the data file to process the data"
Thank you
Anyone else watching this and wondering why on God’s earth they chose to study electrical engineering this stuff is intense although it naught seem easy to some people
It takes time and patience for you to become a natural in this topic. It will come if you invest your time into it!
Hello! Very Interesenting...is a video like this calculating LAeq8hr normalized noise exposure for a noise signal? It was very very interisting? Greetings!
Very nice
please attach a link to the seismic data file. this is a good tutorial but you can't expect anyone to learn from this if the data files are not available
how about for the signal captured by single-component geophone? is the process same????
I have 15 years temperature data. How can I determine the amplitude and the phase shift of the annual and semiannual oscillation of this Temperature data? my guided equationis x(t)=ao + sum(i=1 to 2)Ai(cos2pi/T(t-fi)) where ao is constant, Ai and fi are the amplitude and phase of the annual and semiannual oscillation, t is in months?
Hey can you please send me the seismic data dat file it would be really helpfull.
visualizeSignals is not working I got, Undefined function 'VisualizeSignals' for input arguments of type 'string'. error
where i can get the seismic data pls reply
HI GARA , WHAT DO YOU THINK OF SENTI BIOSCIENCE??????
Thank you for uploading the video. please suggest me how to denoise the financial time series data as I am from a finance background. How to consider the structural breaks and divide the sample based on these transformation.
thanks in advance
Take the FFT of the data, find the peaks, that's is your harmonics, make equal to zero all the rest of data in your frequency spectrum, take the IFFT.
This is quite pointless without the data file to process the data
its so importhant for me
Thanks for you
But low quality of the video
where can I find the helper function?
Where i find this dataset to downalod
hello, i ve seen your lecture very impressiv :)
And if i want to back from STFT(spectrogram) to soundsignal, which fuction should we do? I ve already invspectrogram oder invspecgram oder many things tried, but not worked... Thx :)
i also have same question? can you help me?
I really did not understand that Function of Plot
If you have any doubt , you can check this playlist on Digital Signal Processing-->Digital Signal Processing Matlab: czcams.com/play/PLjfRmoYoxpNr3w6baU91ZM6QL0obULPig.html
please how can i reach you, i have some very important questions
yo bro what do you need maybe i can help
ali bana yardım etsene baba
@@alibade4921 do you have the .m file?
09:58 31:33
Thank you