Warranty Data Analysis on Minitab

Vložit
- čas přidán 19. 08. 2019
- Dear friends,
I am happy to share my next video on ‘Warranty Data Analysis using Minitab Software’. The video explains the popular Nevada format of warranty data collection and how to convert it in to suitable tabular format so that the same can be analysed using Minitab or other software. In this video, we explain the various types of failure data when Nevada format is used. In some of our previous videos, we have already discussed various types of life data i.e. complete, right censored, left censored and interval censored. When all these types of data are present at the same time, we call such data as multiply censored. Such type of data can be analysed on Minitab using the commands for arbitrarily censored data. The videos explains:
1. How to convert data from Nevada format to table format that can be analysed on Minitab
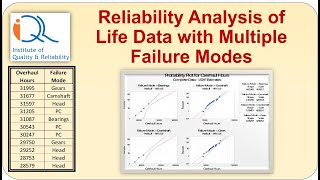
2. How to use Minitab to identify the distribution that best fits our data
3. Estimate parameters of the selected distribution
4. Estimate reliability or probability of failure at specified time(s)
The procedure is explained in detail using an application example. In the video, I have also explained how to estimate expected number of failures by 24 month warranty period and also the 95% upper bound which is the worst-case scenario.
I am sure, you will find this video interesting and useful for practical application of Warranty Data Analysis!
Your feedback on the video is welcome!
If you find the video useful, do not forget to click the like button and subscribe to our channel ‘Institute of Quality and Reliability’.
With best wishes.
Hemant Urdhwareshe


Thank you for this instructive video. It has been most helpful in giving me insights into creating a Nevada Chart and running warranty results in Minitab. Now I have a powerful, predictive tool to use. Excellent!!!
Welcome Jon! I am glad you found it useful!
Great videos from great peoples
Thanks a lot!
Dear Sir, Well explained...thank you
You are welcome!
Excellent Video tutorial to learn warranty data analysis.
Glad it was helpful!
Excellent !!! Very Helpful & Very well presented. Expecting more & more such vedio's for Warranty analysis.
Thank you Sir.
So nice of you Rajesh! We are regularly uploading new videos! Keep watching and share with others who may be interested!
Excellent video sir. Carry on please.
Thanks a lot!
Thank you for this amazing video. Would you please mention away (either Minitab or else) to analyze the Warranty Data for repairable products?
Thanks! Noted!
Dear sir,
Thanks for your explanation.
What if the data is not linear rather is of a curve, how to introduce threshold parameter in this software to check if the data becomes linear or not
For threshold parameter, you need to choose three parameter Weibull and also check for signifciance with p-value for LRT (likelihood Ratio Test). Low p-value indicates three parameter is better fit than two-parameter.
I get an error in minitab when I use data with zero return on a particular month,it says"top 9 rows in column jun-18 should be non-empty" like that....
Please send screenshot on mail hemant@world-class-class.com
Is the failure you considered are repairable or non repairable failure. Can i apply it during any field failure due to Software issue.
The failures discussed in this video are for non repairable systems. Weibull disctribution applies to non repairable systems and for a particular failure mode. For example, an oil seal can leak due to improper installation or dust entry. These are different failure modes and may fit in Weibull with different shape and scale parameters.
Hello sir,
Please explain which distribution to use when we have same AD value..if I use weibull it estimate that around 21000 product will fail in next 36 months and if I use normal distribution it predicted that 75000 products will fail in 36 months..the difference is huge... please suggest
The AD Value comparison is not strictly appropriate as the critical values of each distribution are different. You may visit and read more in this article: www.mdpi.com/2227-7390/6/6/88/pdf-vor#:~:text=The%20interpretation%20of%20the%20Anderson,size%20%5B41%2C42%5D. So the more appropriate comparison is based on p-values. If you see the table in the above article, you will see that the critical values of AD are slightly higher for Weibull which implies that for the same AD values, Weibull will have higher p-values and therefore should get precedence. Moreover, the Normal distribution extends up to -infinity and the time to fail cannot be less than zero. Thus, it looks more appropriate to use Weibull. I am not a statistician and an engineer! So, trying to answer based on what I know. Hope this helps you.
@@instituteofqualityandrelia7902 thank you sir, so nice of you!!
hi, @11:02 63% failure u mentioned but actually it is 66.9% failure right??
No. 63% is correct. For Weibull distribution, by time equal to scale parameter, 63.2% parts are expected to fail. You may like to watch my video on Weibull distribution. Here is the link:
czcams.com/video/dxwlYZ-8_GM/video.html
Sir hindi me dalo na
Good suggestion. Dekhte hai.