Value at Risk Explained in 5 Minutes

Vložit
- čas přidán 4. 06. 2024
- Ryan O'Connell, CFA, FRM explains Value at Risk (VaR) in 5 minutes. He explains how VaR can be calculated using mean and standard deviation. This explanation will be useful for CFA and FRM Candidates. He also explains the following three approaches to calculating Value at Risk (VaR).
Chapters:
0:00 VaR Definition
0:32 VaR Calculation Example
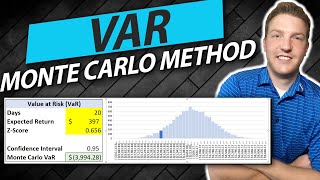
3:00 The Parametric Method (Variance Covariance Method), The Historical Method, and The Monte Carlo Method
📘 FRM Exam Prep Discount - AnalystPrep:
► Get 20% off FRM Part 1 and Part 2 complete courses with promo code "RYAN20". Explore here: analystprep.com/shop/frm-part-1-and-part-2-complete-course-by-analystprep/?ref=mgmymmr
📚 CFA Exam Prep Discount - AnalystPrep:
► Get 20% off CFA Level 1, 2, and 3 complete courses with promo code "RYAN20". Explore here: analystprep.com/shop/all-3-levels-of-the-cfa-exam-complete-course-by-analystprep/?ref=mgmymmr
🎓 Tutor With Me: 1-On-1 Video Call Sessions Available
► Join me for personalized finance tutoring tailored to your goals: ryanoconnellfinance.com/finance-tutoring/
*Disclosure: This is not financial advice and should not be taken as such. The information contained in this video is an opinion. Some of the information could be wrong. This channel is owned and operated by Portfolio Constructs LLC. Some of the links above are affiliate links, meaning, at no additional cost to you, I will earn a commission if you click through and make a purchase.


📘 FRM Exam Prep Discount - AnalystPrep:
► Get 20% off FRM Part 1 and Part 2 complete courses with promo code "RYAN20". Explore here: analystprep.com/shop/frm-part-1-and-part-2-complete-course-by-analystprep/?ref=mgmymmr
📚 CFA Exam Prep Discount - AnalystPrep:
► Get 20% off CFA Level 1, 2, and 3 complete courses with promo code "RYAN20". Explore here: analystprep.com/shop/all-3-levels-of-the-cfa-exam-complete-course-by-analystprep/?ref=mgmymmr
my man using paint. respect
Lol this was my first video of this style and I've since moved on to other softwares 😂
This comment made my day😂😂😂
I respect bro even more now.🔥🙌🏾
Great. Thank you. Now off to my Head of Risk job interview 😂
You got this! Lol
Super effective explanation! It should be called VaR explained in 2.5 minutes, because the explanation is so clear and to the point you can watch it at 2x!
Hahah I love it!
Thanks for the explanation! Quick and effective. Useful introduction for my risk management studies
Glad you enjoyed it Alex! Risk management will be very valuable to learn so good luck
This was really helpful. Thank you!
My pleasure!
Thank you this was really helpful!
Glad it was helpful!
Bro you made me understand something that i was trying to understand for the last 3 months with easy exemples 😅
Thaaank you so much.The explanation was so simple and clear. I loved it !
I'm glad to hear that!
I think this is a great series idea. Take some of the most difficult CFA concepts and break them down in very visual and fairly short videos. The views would be good over a long time period I’d imagine.
Thanks for the feedback Adam! I know this is the type of content I'd like to have come across on CZcams while doing the CFA program. Are there any concepts in particular you'd like to see covered?
Level 2 FRA would probably be a pretty popular topic.
@@collinsx62 I still have PTSD from Level 2 FRA! At this point I'm thinking of starting with Quant and Econ
Triangular arbitrage would be a good video, most people get confused
@@barackhussainobama7336 I got a kick out of thinking Obama was studying for the CFA exams lol. I plan to do some Economics stuff in the future so I should get to triangular arbitrage down the road
Way to go right into the vid. Good info!!
Thanks Keenan! I know this is a topic very close to your heart
This is the most helpful video I've watched on this topic. What happens when you use historical data in a Monte Carlo simulation? Is it a variance of the two methods?
Thank you Jordan! I've got an in depth video on how exactly the monte carlo method for calculating var works here: czcams.com/video/q6qSwwpL26I/video.html
I appreciate the explanatory nature of this video but its important to note actual samples are not normal, hence the importance of skewdness and kurtosis, specifically letptokurtic distrobutions to measure fat tail risk
I'd imagine that Monte Carlo simulations is the most widely used method in industry. Which do you personally use often?
I'd think the same, Monte Carlo or Parametric based on a firm's data and technology. Historical Simulation is the easiest but you're making a huge (and bad) assumption that the next 100 days will be like the previous 100 days for example.
well done. appreciated
Thank you!
Awesomeness redefined
Much appreciated Divya!
Great Video
Thank you
Thank you sir for your video. I have a question
I am a finance student, and I am trying to calculate the CoVaR( Conditional value at risk) and VaR(Value at risk) using quantile regression, in order to analyze systemic risk for the banking system. So I already computed the coefficients alpha and beta for the CoVaR equation, using quantile regression in Eviews.
Now i have to estimate the VaR for every bank when p=0.05 , So according to this approach, the VaR is equal to the total of quantiles computed for p=0.05 , using Rankit-cleveland definition.
I should get a result that look like this, but I do not know how to do it :
Descriptive Statistics for RATJ
Categorized by values of RATJ
Date: 11/13/17 Time: 00:57
Sample: 1/05/2010 11/03/2017
Included observations: 1956
RATJ Quant.* Obs.
[-0.1, -0.05) NA 4
[-0.05, 0) -0.023874 816
[0, 0.05) 0.000000 1132
[0.05, 0.1) NA 4
All -0.017742 1956
*Quantiles computed for p=0.05, using the Rankit-cleveland definition.
RATJ is the time serie for daily stock returns of the bank ATJ.
Thank you so much for your time sir.
Hello! I'm sorry but for a level of this much detail, you may want to ask on a Stackexchange forum. I also have several other videos on calculating VaR that you could check out
@@RyanOConnellCFA i figuired it out and graduated a month ago haha
Thanks a lot for your reply sir.
Hi,
Does the parametric methods mean we know the distribution of the potential loss random variable?
With the parametric method we should know the standard deviation. And in my experience, standard normal distribution has been assumed for exams. In real life, that assumption likely wont hold up however
Could you please explain how to calculate VaR for operational risk.
Sir thanks for your explanation. What is rolling VaR
I wasn't familiar with rolling VaR before you asked. This link helped me to understand www.atoti.io/market-risk-analytics-in-python-interactive-rolling-var/
Awesome
Thank you for your video. I'd like to point out that a Z-score of 2.33 gives us 98% confidence interval instead of 99% as claimed in the video. 99% would be 2.58 Z-score.
I believe the value I showed in the video is correct for a 2 tail test. You may be looking at a 1 tail test Weixin
good
What is the Cost at risk (CaR) , and how it differs from the value at risk (VaR) ?
Hey, I can make a video on this topic in the future. Cost at Risk (CaR) is a risk management metric similar to Value at Risk (VaR), but it specifically focuses on the potential costs associated with a risk, including direct costs, opportunity costs, and any associated loss of value. Unlike VaR, which typically estimates the maximum potential financial loss over a specific period for a given portfolio or investment at a certain confidence level, CaR encompasses a broader range of potential costs beyond mere financial loss. For example, in a project setting, CaR might consider the costs of project delays, reputational damage, or regulatory penalties, in addition to direct financial losses.
Shouldn't the parametric and the monte carlo simulations give close results since they're both based on the same CAGR and St. Dev.? Makes me wonder if it's even useful to do a monte carlo simulations since it's straight up to calculate this.
Parametric VaR and Monte Carlo simulations can indeed yield different results due to the way they handle underlying assumptions and distributions; Monte Carlo simulations provide a more detailed risk analysis by accounting for non-linearities and path dependencies that parametric VaR might overlook. While parametric VaR is quicker and simpler to calculate, Monte Carlo simulations offer a comprehensive view of potential future scenarios
If you are an Excel person you can find my more deep dive analysis on both methods below:
Parametric VaR: czcams.com/video/y4AOyA28d0M/video.html
Monte Carlo VaR: czcams.com/video/q6qSwwpL26I/video.html
Is this two sided 95% confidence interval?
This is a one-tailed test! The correct z-score is 1.65 for a 95% confidence interval one tailed test as shown in the video
Just one doubt when we need to find VaR for IRS , which component we need to take and how to find it. Could you please prepare one video on it
Hello, just to be clear, by IRS you mean an interest rate swap right?
@@RyanOConnellCFA Yes Ryan
@@Akash24729 I think what I'd do to find the VaR for an interest rate swap would be to run a monte carlo simulation for like 10,000 different scenarios of interest rates based on a standard normal distribution and then find the cut off for the 5th percentile worse loss as an example. You could follow a similar methodology as this video: czcams.com/video/q6qSwwpL26I/video.html
@@RyanOConnellCFA thank you so much
@@Akash24729 It's my pleasure!
Great, now I have to go watch a video to explain this video
Lol!
Can we say the parametric method is just 1 scenario of the 1000 scenarios of the Monte Carlo simulation?
No this is not accurate. The parametric method and the Monte Carlo simulation are 2 entirely different approaches to calculating VaR
@@RyanOConnellCFA Hmm if so, then I didn't understand the video.
Isnt the z-score at 95% confidence interval 1,96 not 1,65?
Hello, I believe you are confusing 1-tailed and 2-tailed tests
what if you're provided with certain number of days
I believe you'd multiply the annual VaR number shown in the calculation of the video by the square root of the number of days divided by 252. 252 is the approximate number of trading days in the year.
i guess the value of z for a 95% confidence interval is 1.96?
Yes, that is correct! Keep in mind that it will be different for 1 tailed and 2 tailed tests
Where do we get the 1.65?
The value of a z-score for a 95% confidence interval is 1.65 for a one tailed test
@@RyanOConnellCFA Thank you, how do i arrive to 1.65?
@@duduchaka1108 If you google "1 tailed test z score table" you can look at the 95% confidence interval and you will find 1.65. It is a given that you don't need to calculate
should we use the word maximum. Maximum potential loss at x% confidence level …
I think you could say that. Some descriptions of VaR include the word maximum
Isn’t the 95% CI z=1.96?
Julio, no you are confusing this with a two-tailed test when it is in fact a 1 tailed test. The correct z-score is 1.65 for a 95% confidence interval in a VaR calculation as you can see in the link below:
www.investopedia.com/articles/04/092904.asp
@@RyanOConnellCFA I actually think you are right with 1.65 since this is a one-tailed test no? 1.65 is used for confidence intervals of 90% in two-tailed tests (so 5% in each tail). So it would make sense to use 1.65 for the one tailed test no?
@@stevde88 Thank you for providing me with some redemption on this video! Haha.
I just confirmed that the 1.65 in the video is correct as you described
You put z score in the question already!! You shouldnt have done that and make a question plz where you have to find z score and also the x i.e. Var
Hello Syed. Do you mean a question where you have to look in the Z-score table and find the z-score?
@@RyanOConnellCFA I am studying Value at Risk in Management Accounting and the question states only the mean value and standard deviation. Now they have magically put the value of Z score from somewhere I am not getting how did they calculate it. I somehow got a hang of it from confidence level % but still its vague!!
Not complicated at all :/
जय श्री राम🙏🙏🙏🙏🙏🙏🙏
👍