Enrichment analysis: A short introduction to the core concepts of gene set enrichment analysis

Vložit
- čas přidán 15. 07. 2024
- A short introduction to the core concepts of enrichment analysis and its applications to bioinformatics analysis of gene lists. The presentation provides a minimal introduction to the basic idea of enrichment analysis, correction for multiple testing, importance of custom backgrounds, analysis of ranked gene lists, and applications beyond gene function.
0:00 Introduction: characterization of a gene list by finding overrepresented classes of genes
0:20 Basic idea: testing for enrichment of a single term, Gene Ontology, and systematic enrichment analysis
1:32 Multiple testing: 20 colors of jelly beans, Bonferroni correction, and false discovery rate
3:00 Custom background: the problem of using genome-wide background,
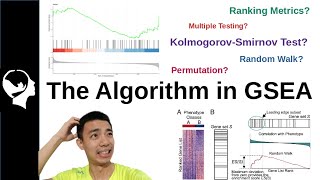
4:42 Ranked lists: mapping GO terms on a ranked gene list and significance testing
6:15 Beyond gene functions: gene set enrichment for diseases/tissues/transcription factor, kinase enrichment analysis, and organism set enrichment in microbiomes


Thank you thank you thank you thank you! I’m training for my PhD in neuroscience and my project involves transcriptomics. I’ve had to teach everything to myself. This is the clearest most informative resource I’ve found to date. I wish I had found it sooner. Thank you
Thank you, wonderful to hear! This is precisely why I make all these videos; I want to make easily accessible teaching material available to everyone, especially for people who do not have easy access to people who can teach them.
@@larsjuhljensen There's something I'm not very clear on. I'm new to this so I apologize if this is a stupid question. What I'm confused about is if you already have your rna-seq reads that have been aligned with the reference genome and have obtained the differentially expressed data then what is the point of gene set enrichment analysis since you already know which genes are expressed differently between conditions? Are you trying to determine how they are differentially expressed such as elucidating their transcriptional networks? But also would that not have shown up in the differential expression data too? Or are you trying to find out what products are encoded by the differentially expressed genes?
@@jessehines4044 You're basically trying to find the patterns in what is regulated. If you had only a few significantly regulated genes, you would clearly be done already. But typically you have a list of maybe 500 genes. Going through them one gene at a time does not give you any overview. Enrichment analysis is one tool to provide an overview, effectively summarizing a long list of genes in terms of pathways and functions.
@@larsjuhljensen Thank you so much for clarifying!
This is a wonderful introduction. Thank you so much for explaining it in such a simple manner.
Thanks lars this is great. I was particularly happy to hear you speak about ranked lists.
Glad you enjoyed it! Indeed, ranked lists is an important complementary approach that is often ignored. The main advantage in my view is, that it does not require you to define, which genes you deem significantly regulated in your experiment, which is bound to be somewhat arbitrary (there is no such thing as "the right p-value cutoff").
THANK YOU!! I love your explanations.
Thank you - always encouraging to hear that people like the videos :-)
Thank you for this great video. You can explain so well!
Thank you! Enrichment analysis is one of those topics that I know many students find hard to understand. So I tried to keep all the statistics out of it and just get the idea across, which to me has always been incredibly simple.
Thank you for such an informative video on enrichment analysis!!
I'm glad you and so many others are enjoying the videos :-)
this was very helpful and clear. Thank you!
Thanks a lot - I'm glad you found it helpful!
THANK YOU SO MUCH!
You are most welcome! :-D
Thank you Lars. Sharing it to my collaborator already.
Thanks for sharing, much appreciated!
What a concise !!!
Thanks!
perfect
Thank you!
Great session
Thank you!
Nice video! thanks a lot for explaining all these basic concepts, you are really kind for sharing all this.
The only think I am not following is that you proposed a KS test check if GO categories have a non-random distribution across a ranked list, however as far as I understand, KS test is a non-parametric version of a t-test, which compares two groups. I am not sure if a KS test can be used the way you propose, but I will keep reading to find out :) thanks again.
OOh! I guess one could apply KS test to compare the values associated to genes that belong to a given GO term vs the values from genes that do not overlap this GO. Is this the way you are proposing to implement KS test for ranked lists?
Exactly! If you have values for your genes, you have two distributions for a GO term: one for the genes with the GO term and one for the genes that do not have the GO term. And you can then use a KS test to find out if the two distributions of values are significantly different. And just to be clear, the KS test is just one of several options.
Hi, firstly I want to say that your videos are amazing- they are so useful and clear! I have a question about pathway mapping so I'm not sure if this is the correct video to ask under. I have gene expression data (fold change) from my qRT-PCR analysis. The genes are not from a microarray, they are genes of interest selected by me. I would like to map these onto relevant pathways to see if them being up or downregulated changes other genes in the pathway and also to see if the biological processes they are involved in are changed. What is the best way to do this? KEGG pathway analysis? Thanks kindly in advance for your help.
Thanks a lot - and good question although not one that can be solved by enrichment analysis. I do not have a definitive answer in terms of a tool that will do what you are looking for. However, I would recommend that you take a look at the OmniPath resource. Their regulatory network consists of edges that are both directed (A->B is not the same as B->A) and signed (distinguishes between up- and down-regulation). That would seem to be what you would need to be able to predict the possible consequences on other genes in the pathways.
Thank you for your great effort, your videos are really helpful and very appreciated!
Regarding the issue with the selection of an appropriate background for enrichment: there is an ongoing debate whether one should use all observed genes/transcripts/proteins as background or only all the ones which were found to be regulated in any of the treatment. You said that one should test the regulated proteins against the observed proteome, and I assume that this would include all proteins. Is that correct? In other words: would you say that it is better to test against the complete observed proteome or test a specific treatment effect against all proteins that were observed to be regulated in all kinds of treatments from that experiment?
What I was talking about was the situation where you do not have multiple different comparisons. In that case, you have two options: using the full set of proteins encoded by the genome (i.e. comparing regulated to genome-wide background), or using only the set of proteins that were actually observed in the experiment (i.e. comparing regulated to non-regulated). In this situation, I argue that one should compare the regulated proteins to the observed proteins, not the full set of proteins encoded by the genome.
If you have an experimental setup in which you have multiple conditions and multiple comparison, you will also have multiple sets of regulated genes/transcripts/proteins. In this case, it could definitely make sense to compare the ones regulated in one condition to those regulated in any condition. I do not have a strong option on which is the better to do; I think it somewhat depends on how similar the multiple conditions are. In either case, if one is working on a simple case/control setup, this alternative option is not even there.
In summary, I mainly just want to warn people against using the genome-wide background for enrichment analysis. That is the default in every tool that I know of, and it is almost always a bad idea. One should, in my opinion, almost always use a custom background. But which custom background is up for debate :-)
@@larsjuhljensen I do not know much about this, but this paper suggests that analysing up- and downregulated genes is a better approach that analysing the entire differentially expressed genes. www.ncbi.nlm.nih.gov/pmc/articles/PMC3899863/
That is another option, in this case one simply does two separate enrichment analyses. However, a paper looking only at cancers is not enough to convince me that it is always the better option to do so. Also, in more complex studies with time courses or multiple conditions, the world is not as simple as "up or down". In those cases you can run clustering on the expression profiles of the significantly regulated genes/proteins and then do a separate enrichment analysis per cluster.
Thank you Lars for this video. I'm sorry but I still don't understand the concept of mapping ranked gene lists on GO terms. Ranked gene lists are lists of DE genes ranked by log2FC values, is that it? I don't understand then what corresponds to the red lines or the blue lines into the ranked list (grey bar). And the concept of mapping, what is mapped to what. Thanks!
In the general case, the ranked lists could be anything sorted by anything. But in the case of gene set enrichment analysis, it would be genes sorted by, for example, log2FC. The gray box represents the entire sorted list of genes. The color lines within it represents the genes having a certain annotation, for example, a Gene Ontology term. We are thus looking to see whether the genes with the annotation in question are randomly scattered across the sorted list of genes or not, i.e. whether the term is significantly associated with the sorting. When doing a GO term analysis, this will be done for all GO terms, one at a time. The sorted list will remain the same for all terms, but the colored lines will change, since each GO term will correspond to a different set of genes in the sorted list.
But it does not have to be about genes and GO terms at all. If I wanted to test which diseases are associated with age, I could take the entire population of Denmark and sort everyone by age. I could then go into electronic health registries and look up which diseases they have been diagnosed with. Each disease would be a set of colored lines in the figures, corresponding to the individuals diagnosed with that disease. If a disease is correlated with age, the individuals with the disease would not be randomly scatted across the age-sorted list.
Thank you so much. Could you please make a video tutorial on centiscape plugin of cytoscape? I want to knw hub and bottleneck genes in my network ad i think so, centiscape in cytoscape will tell us about it.
I have never used CentiScaPe, so I would not be the right person to make a tutorial on it. From what I can see, it has not been updated since 2017, and calculates many of the same network parameters that the Network Analyzer tool that comes with Cytoscape can also calculate. Have you tried just using Network Analyzer?
@@larsjuhljensen No, i didn't use Network analyzer tool. can we use the Network analyzer tool to identify hub and bottleneck genes?
@@ayeshawadoodwadood5679 It calculates various forms of centrality metrics, including degree centrality and betweenness centrality. But before you do that to identify the most important genes in your network, I would suggest you watch my video on "the dark side of network analysis" (czcams.com/video/Hhu8-gdrklI/video.html).
@@larsjuhljensen sure Thank you
this person is famous