
- 12
- 327 788
Janelle
Registrace 21. 10. 2011
Using gretl as a Statistical Table
This video demonstrates how to use gretl instead of a statistical table with the Standard Normal Distribution as an example.
zhlédnutí: 1 588
Video
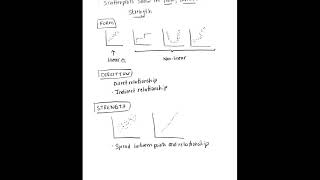

Scatterplot (form, direction, and strength)
zhlédnutí 4,3KPřed 4 lety
Scatterplot (form, direction, and strength)

How to Perform Simple Linear Regression in gretl
zhlédnutí 9KPřed 6 lety
How to Perform Simple Linear Regression in gretl

How to Generate Data from a Normal and Uniform Distribution Using gretl
zhlédnutí 9KPřed 6 lety
How to Generate Data from a Normal and Uniform Distribution Using gretl

How to Create a Histogram and Scatterplot using gretl
zhlédnutí 19KPřed 6 lety
This video demonstrates how to create a histogram and a scatterplot in gretl.

Specification Tests: Part 2 (Video 5 of 7 in the gretl Instructional Video Series)
zhlédnutí 17KPřed 9 lety
The gretl Instructional Video Series consists of seven videos that instruct and demonstrate how to use gretl to apply econometric techniques. The videos are designed to be 'hands on' and will be the most effective if the students follow and actively participate using gretl on their own computer while watching the video. The videos can be used for individual study or for in-class presentation. T...

Specification Tests: Part 1 (Video 4 of 7 in tbhe gretl Instructional Video Series)
zhlédnutí 43KPřed 9 lety
The gretl Instructional Video Series consists of seven videos that instruct and demonstrate how to use gretl to apply econometric techniques. The videos are designed to be 'hands on' and will be the most effective if the students follow and actively participate using gretl on their own computer while watching the video. The videos can be used for individual study or for in-class presentation. T...

Cointegration (Video 7 of 7 in the gretl Instructional Video Series)
zhlédnutí 33KPřed 9 lety
The gretl Instructional Video Series consists of seven videos that instruct and demonstrate how to use gretl to apply econometric techniques. The videos are designed to be 'hands on' and will be the most effective if the students follow and actively participate using gretl on their own computer while watching the video. The videos can be used for individual study or for in-class presentation. T...

ARIMA(p,d,q) Models (Video 6 of 7 in the gretl Instructional Video Series)
zhlédnutí 48KPřed 9 lety
The gretl Instructional Video Series consists of seven videos that instruct and demonstrate how to use gretl to apply econometric techniques. The videos are designed to be 'hands on' and will be the most effective if the students follow and actively participate using gretl on their own computer while watching the video. The videos can be used for individual study or for in-class presentation. T...
OLS Estimation (Video 3 of 7 in the gretl Instructional Video Series)
zhlédnutí 65KPřed 9 lety
The gretl Instructional Video Series consists of seven videos that instruct and demonstrate how to use gretl to apply econometric techniques. The videos are designed to be 'hands on' and will be the most effective if the students follow and actively participate using gretl on their own computer while watching the video. The videos can be used for individual study or for in-class presentation. T...
Basic Statistics (Video 2 of 7 in the gretl Instructional Video Series)
zhlédnutí 30KPřed 9 lety
The gretl Instructional Video Series consists of seven videos that instruct and demonstrate how to use gretl to apply econometric techniques. The videos are designed to be 'hands on' and will be the most effective if the students follow and actively participate using gretl on their own computer while watching the video. The videos can be used for individual study or for in-class presentation. T...
Introduction to gretl (Video 1 of 7 in the gretl Instructional Video Series)
zhlédnutí 48KPřed 9 lety
The gretl Instructional Video Series consists of seven videos that instruct and demonstrate how to use gretl to apply econometric techniques. The videos are designed to be 'hands on' and will be the most effective if the students follow and actively participate using gretl on their own computer while watching the video. The videos can be used for individual study or for in-class presentation. T...
Hi Janelle, First of all thank you for these great videos. If possible make a series of videos on time series i.e. VAR/VECM and Panel data analysis. Thanks .
Johansen ?
For the JB test, the null hypothesis is that the residuals are normally distributed. Therefore to accept the null the p-value must be greater that 0.05. In the video, the p-values are high i.e. greater than 0.05- therefore normally distributed. Please check your explanations for the other tests too. These are the other way round and misleading.
Thank you for your comment. The p-values are large, so we fail to reject the null hypothesis that the residuals are Normally distributed. Accepting and failing to reject are similar, but not exactly the same. Here is a good explanation: liesandstats.wordpress.com/2008/09/08/accept-the-null-hypothesis-or-fail-to-reject-it/
Thank you
not me watching those videos on 1.5 the night before the exam
Clear step by step instructions and presentation. Thanks for sharing.
Where is the file CrudePrice ? Including in sample Gretl files?
What does C.V. stand for?
Cross Validation
Very clearly! Thank you so much!
Thank you, the video is awsome. Does anyone know how can I execute SARIMA (p,d,q)(P,D,Q)s particulary the the last coeficient "s" ?
How to save Gretl file with session icons tho? ;//
I LOVE YOU! Thank you so much!
how do you make the labels for the points show.
So if you have more than 5 variables, what do we do if for the cointegration test the p value is bigger than 0.05? Can we still continue and do a ECM??
Hi Bennet - Please be sure to learn econometric theory before analyzing data. The book by Enders is very good. Here, the Johansen test should be performed given you have five variables.
thanks
why should the p-value indicates that at a 5% level of significance ?
Thank you!!
I have a question. What does "Full range 1979:01 - 2011:01" means and what it would mean if it was written like this "Full range 1979:01 - 2011:02" ? If anyone could help me I would be gratefull
it means that you have downloaded data from january 1979 to february 2011, instead of january 1979 to january 2011
@@syazwin8911 thank you
Please I need the data you used
So incomplete :(
Thank you a lot
does it also work with the range in the bracket?
in this dataset how to find the average price of houses by Utown variable. require help
How to export the results from GRETL
can I have ur email...I need help regarding panel data modeling..please.
God bless ya janelle, thank you
The Chow test should properly be used with a wide variety of possible break points, not just the one you expect. Otherwise you bias the test.
Thanks for the information, do you know any other good videos like this one we learn from?
@@Yasha-uh9vj Not offhand. I have a tutorial on statistics on the web, but you may find it a bit elementary: bartonlevenson.com/ISK/Statistics/00Stats.html
Hello, can you explain why is 1:1 the p and q please?
Thanks! It was really useful
Thanks
Thank you so much, im a PhD student and this helped me a lot . can i only use the f test in OLS to say that whether my module is significant or not?
Thanks, I from Brazil and I found here the explanation that I wanted .
Just to out do Jay. Thank you sooooooooooooooooooooooooooooo much.
Thanks for this explanation.
This is my first time learning about time series forecasting yet this ARIMA lesson has given me so much understanding. Thanks Janelle
is it possible to perform GLS regression in Gretl?
Thanks for a wonderful presentation. i found this vedio useful. i downloaded the gretl software from google and am forecasting residential estate price using arima. At the end the forecasting model shows some figures with negative sign instead of residential price as it is in my data. so i couldnt understand why and i cannot interpret it. am expecting to see the price in Y axis and years in X axis. Moreover at the end of the forecast it also cannot show forecast evaluation.
Sorry it shows something like this in the graph in Y axis like 2.8e+007 , 2.6e+007, 2.4e+007, 2.2e+007, 1.8e+007..etc. It didnt show me the price of real estate as it is in my data and as i see in your forecasted model. Thanks
Thank you very much . I do not know how to make progressive type ii censoring in Fortran programming. Can you help me.
wow really excellent video
Thank you sooooooooooo much
And why not a video about the GMM model?
Hello. How to calculate Η0:μ1 & Η1:μ2???? How to add alfa value???
they didn't rellay get into how to select p and q, "yeah according to the correlogram it's obviously 1,1" well it's not obvious for me
I need 3 variable databases of (social economic )