Logistic Regression Details Pt 3: R-squared and p-value

Vložit
- čas přidán 27. 06. 2024
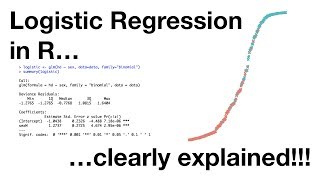
- This video follows from where we left off in Part 2 in this series on the details of Logistic Regression. Last time we saw how to fit a squiggly line to the data. This time we'll learn how to evaluate if that squiggly line is worth anything. In short, we'll calculate the R-squared value and it's associated p-value.
NOTE: This StatQuest assumes that you are already familiar with Part 1 in this series, Logistic Regression Details Pt1: Coefficients:
• Logistic Regression De...
For a complete index of all the StatQuest videos, check out:
statquest.org/video-index/
If you'd like to support StatQuest, please consider...
Buying The StatQuest Illustrated Guide to Machine Learning!!!
PDF - statquest.gumroad.com/l/wvtmc
Paperback - www.amazon.com/dp/B09ZCKR4H6
Kindle eBook - www.amazon.com/dp/B09ZG79HXC
Patreon: / statquest
...or...
CZcams Membership: / @statquest
...a cool StatQuest t-shirt or sweatshirt:
shop.spreadshirt.com/statques...
...buying one or two of my songs (or go large and get a whole album!)
joshuastarmer.bandcamp.com/
...or just donating to StatQuest!
www.paypal.me/statquest
Lastly, if you want to keep up with me as I research and create new StatQuests, follow me on twitter:
/ joshuastarmer
Correction:
13:58 The formula at should be 2[(LL(saturated) - LL(overall)) - (LL(saturated) - LL(fit))]. I got the terms flipped.
#statquest #logistic


Correction:
13:58 The formula at should be 2[(LL(saturated) - LL(overall)) - (LL(saturated) - LL(fit))]. I got the terms flipped.
Support StatQuest by buying my book The StatQuest Illustrated Guide to Machine Learning or a Study Guide or Merch!!! statquest.org/statquest-store/
Hi Josh,
Love your content. Has helped me to learn a lot & grow. You are doing an awesome work. Please continue to do so.
Wanted to support you but unfortunately your Paypal link seems to be dysfunctional. Please update it.
4 days on this channel, I've learnt more than 12 weeks' lectures at college.
Thank you, Josh!!
Awesome!!! I'm glad you're enjoying my videos. :)
@@statquest Enjoying them as well as hoping they'll help me ace my Data Mining exam tomorrow 😂
@@hayagreevansriram326 Good luck tomorrow and let me know how it goes.
what do you think about the tuition colleges charge?
Same 😂
I've been binge-watching many of your videos recently to learn more about stats & RNA-Seq and I just wanted to say thank you for all the work you do! these videos are amazing and have been so incredibly helpful in explaining things :)
You’re welcome!!! I’m glad you like my videos so much. I have a lot of fun putting them together. :)
ps, I have 3 more videos on logistic regression coming out in July. :)
I always wondered what the interviewers wanted me to say... I didn't know what I didn't know... until this.
bam!
I'm addicted to these intro songs..
:)
Your explanation always unique sir. I completed Masters in Statistics, my brother did PhD in Statistics had explained Logistic Regression
theoretically but not satisfied. I have huge confidence on your explanation and hard work so listened got 200 % satisfication. Thank you so much sir
Thank you!
I've been having difficulty going through grad level stats after taking a loong break from academics and found your videos very useful and so much fun, thank you !
Thank you! :)
Hi, Josh. I started watching your video 3 years ago. At that time, I was a master in bioinformatics, I came across many questions in statistics while doing my research. Your video is clear and instructive, which allows me to put the models mentioned in your video into my research very quickly. It means a lot to me. Now I have already started my career as a PhD candidate in statistical genetics. Your videos have really helped me a lot at an important time in my career, I can't put your name in my journal article, but it deserves a place there, a sincere thank you for the video you uploaded. Wish you happiness every day.
Thank you very much!!! I'm so glad that my videos have helped you and good luck with your PhD! BAM! :)
Awesome vids!! I don’t miss a statquest
Thank you! :)
Amazing Thank you Josh!
You’re welcome! I’m glad you like the videos! I have 3 more on Logistic Regression coming out in July. :)
First of all a million thanks for your work man! It's really outstanding and almost infuriating to think how bad teachers are most of the people in stats by contrast. Got two questions: first, you say we can't use least squares since in the log odds scale the residuals are infinite, couldn't we just use them in the probability scale with the squiggly line? Second, are you planning in eventually doing a MCMC StatQuest? That'd be reaaaaally handy. Thankss
You are a GENIUS. Hats off to you!
Thank you!
This is great great explanation, thanks!
Thanks!
Hi Josh,
I really enjoy these videos. Can you possibly do one that relates extreme value theory ( I'm thinking of T1EV) to the logit function?
this series is great! Thanks.
Glad you enjoy it!
this is extremely well explained!!much appreciated!
Thank you! :)
Thank you Josh, I’m a PhD student from China, and I’ve never learnt logistic regression before. But this is sooooo good for beginners like us, clear examples, clear explanations, humorous way of talking. I really appreciate you for making these fantastic videos. This gonna help me finish the most difficult quant. data analysis chapter. Thank you so much.
Btw the singing at beginning is cute as always XDD
Thank you very much! :)
Thank you so much for your videos!
Glad you like them!
I'm watching your videos from Colombia and it's amazing how trivial has become distance and money to get access to extremely good quality knowledge , I really appreciate the work you put on your videos it have really helped me a lot on improving my Statistical analysis skills , thank you!
Hooray!!! I'm so glad you can watch and learn from my videos. I'm very passionate about helping everyone learn.
Now I can't wait for the deviance videos!
I've got the slides all done for it - so it's ready to go. The bummer is that I'm traveling a lot in the next two weeks so it won't be out for a while... unless I can somehow make it happen this Friday.... I'll see what I can do.
What a prolific teaching Josh! Enjoy your song as well! :)
Thank you! :)
Increible! Saludos desde Argentina
Gracias!!! :)
Excellent! Much appreciated!
Thank you!
Who liked the way he says StatQueeest!
bam!
I am finally clear. Time for relu logistic model
bam! :)
Enjoying going through the logistic regression StatQuestline (i.e. playlist) :D
Small nitpick @3:09 -- the horizontal line corresponding to the mean of the data is *not* the "worst" fitting line in a sum-of-squared-residuals sense (you can make some pretty bad-fitting lines if you wanted to ;p ). It's actually "the best-fitting line (in a sum-of-squared-residuals sense) when you're forced to have a slope of zero". (It's the best-fitting model with 1 less **degree of freedom** than the model that includes a potentially non-zero slope.) This corresponds to a flat line "y = (mean of the data)".
Very true.
Very useful content 🔥
Thank you! :)
I am currently on your Machine Learning playlist, Josh. Keep up the good work
Thanks, will do!
I found out your channel 2 days back. Since then, my learning curve is going towards infinity (Original axis & not on the log odds axis :P). superb videos & content. Thanks a lot MAN !! Also one more suggestion, can you also include the cost function of the respective model so that it is 100% complete.
Awesome! I'm glad you like my videos! :)
@@statquest Hi Josh, Can you please come up with Image processing algorithms or NN models as well
@@bhargavpotluri5147 I'm working on the NN videos.
@@statquest Wow, Thanks Josh :)
Amazing content please continue to upload videos always and grow this channel🎉
Triple BAM🎉
Thank you! :)
amazing!!! So helpful !! the song makes it ever greater!!! Thank u!!
Thanks! :)
Dziękujemy.
Thank you very much for supporting StatQuest!!! TRIPLE BAM!!! :)
you are single-handedly saving my bachelor's thesis! I could not make sense of anything about logreg in text books. Thank you!
Good luck! :)
@@statquest Thanks! (: and while we're at it, can I ask what program you use to make your graphics?
@@jaegermeistersfriend I draw most things by hand in Keynote. Other graphs are created in R.
Thank you for the help! This series is amazing.
at 12:31 would the degrees of freedom for 2 independent variables be 2? and for 3, 3, etc?
I believe that is correct.
Hey Josh, I was wondering about the projecting of points at negative or positive infinity onto the candidate line, or just any line in general. You just say that we project the data onto the line at 5:57. But how does the math work?
Here is what I think:There are 5 mice obese and 4 not obese,totally 9 mice.Without considering for weight,the probability of a mouse being obese is 5/9=0.56.If we map the probability(5/9) to the right figure,that is log(0.56 / 1-0.56)=log(5/4)=0.22.
so understandable
Hooray!
Here it comess.... Great teaching josh... Thanks for all ur efforts...
You are welcome!!! I'm always so happy to hear how much you like the videos! :)
StatQuest with Josh Starmer this is awesome channel for machine learning... Hope next exercise is in R
I've got one more video, on the saturated model and deviance statistics, and then we put everything together with "Logistic Regression in R".
StatQuest with Josh Starmer woowwww.... We love statquest videos
Que gran video!
Muchas gracias!
you're better than my prof
BAM! :)
Nice stuff as always! If you're still taking video ideas I'd love to see some stuff on Bayesian models, monte carlo, markov chains :)
Those are all on the to-do list... I'll get to them one day! I hope that day is soon! :)
Your videos are amazing! You make statistic modules so simple and understandable, thank you!
Glad you like them!
Hi Josh, really good explanations :) I have seen already all the logistic regression series. Just one question: I would assume that the Part 1 [Coefficients] is basically the last part occurring when performing a logistic regression, right? I mean the algorithm will first optimize the squiggly line to the best fit(Part 2) , then evaluate for the significance (Part 3) . Finally the results can be seen by interpreting the coefficients (Part 1) which are given in terms of log(Odds).
I hope you understand my question :) Thanks in advance and happy holidays.
Marcelo
You are correct. The reason I organized the videos the way I did was to follow the output that R gives you when you do Logistic Regression. The first thing it prints out are the coefficients, and the last thing it prints out is the R^squared. So I was just going from the top and working my way down the output.
@@statquest Thank you 😊. Best regards from Germany
@@ml6352 Thanks! :)
Hi, Josh
I would really appreciate if you could help me with some doubts I have dealing with my own data. I'm trying to figure out if some morphological features determine reproductive status (0 = not reproductive in a given season; 1 = reproductive in a given seaosn) in a wild passerine. Instead of analyzing each phenotypic trait separately, we decided to do a logistic regression where status is the response variable and morphological features the explanatory one. In my case, the capture year is placed as a random factor in our model. My question is: is there a better way to get an R^2 for mixed generalized models? I've enjoyed these series a lot since they'd helped me build confidence and knowledge about what I was doing! Thank you so much!
This is the best channel i've come across to understand the statsbehind the ML algorithms thaaankyou Josh ❤️ love from India.
Awesome, thank you!
You are the best musistician in the world!
Triple bam! :)
I wonder why you mentioned SS(mean) as the worst fitting line. Clearly, there are worse lines that we can fit. I always thought SS(mean) as a base value, the line that minimizes the sum of squares if we only had y values and no x values (no input).
By the way, loving your lectures, they are all clearly explained and super helpful!
The mean of the thing we want to predict is thought of as the worst fitting line because that is what we would fit if we had nothing to predict (no x-axis value).
Hello Josh, again much thanks for the video.
QQ- @13:27 how did you calculate the p-value using formula [ 2*(LL(fit) - LL(overall Probability))]?
I've already watched P-value video but unable to figure out. Don't know what I am missing.
Thanks in advance!
Hi! I think Josh would give you a much better explanation, but i'll try :)
Chi-square distributions come in different degrees of freedom. In the case of logistic regression, the degrees of freedom is 1 (2 parameters in the logistic regression (y-intercept and slope), and 1 parameter for the overall probability (y-intercept, just a horizontal line), thus 2-1=1). Thus, you need to use the Chi-square distribution with 1 degree of freedom. *The p-value is given by the area under the 1-DoF chi-square distribution (integral) from [ 2*(LL(fit) - LL(overall Probability))] to infinity!*
In the first example:
Since, by definition, the area under a statistical distribution curve is always 1, and [ 2*(LL(fit) - LL(overall Probability))] = 0, the integral is over the entire distribution (chi-square support (domain) is from 0 to +infty), thus 1. Therefore, the p-value = 1.
In the second example:
[ 2*(LL(fit) - LL(overall Probability))] = 4.82. The integral of the 1-DoF chi-square distribution from 4.82 to +infinity is 0.03. Thus, the p-value = 0.03, which is statistically significant in most situations, since it is less than 0.05.
Hope this helps!
The formula to calculate the p-value from the test statistic in logistic regression is based on the principles of hypothesis testing and the properties of the standard normal distribution.
Here's a step-by-step explanation of how the formula is derived:
1. **Null Hypothesis and Test Statistic**: In hypothesis testing, you start with a null hypothesis (\(H_0\)) that assumes no effect (e.g., the coefficient is zero). The test statistic \(z\) is calculated to measure how far the estimated coefficient (\(\hat{\beta}\)) is from the null hypothesis value (usually zero). The formula for the test statistic is:
\[ z = \frac{\hat{\beta}}{SE(\hat{\beta})} \]
2. **Standard Normal Distribution**: Under the null hypothesis, the test statistic \(z\) follows a standard normal distribution (\(N(0, 1)\)). This is a fundamental property of hypothesis testing.
3. **Two-Tailed Test**: Since you're interested in whether the coefficient is significantly different from zero (two-tailed test), you want to calculate the probability of observing a test statistic as extreme as \(z\) in either tail of the standard normal distribution.
4. **Cumulative Distribution Function (CDF)**: The cumulative distribution function (\(\Phi(z)\)) of the standard normal distribution gives you the probability that a standard normal random variable is less than or equal to \(z\). In mathematical notation: \(\Phi(z) = P(Z \leq z)\).
5. **Probability Calculation**: The p-value is the probability of observing a test statistic as extreme as \(z\) in both tails of the distribution. Since the standard normal distribution is symmetric, you can calculate the probability of observing a test statistic as extreme as \(z\) in one tail and then multiply it by 2 to account for both tails:
\[ p = 2 \cdot (1 - \Phi(|z|)) \]
Here, \(|z|\) ensures that the value inside the cumulative distribution function is positive.
In summary, the formula \(p = 2 \cdot (1 - \Phi(|z|))\) calculates the p-value by determining the probability of observing a test statistic as extreme as \(z\) in both tails of the standard normal distribution. If this probability is small (i.e., the p-value is small), you have evidence to reject the null hypothesis and conclude that the coefficient is statistically significant.
So we took log(5/4) = .22, plugged it into the (e/1+e) equation and got .56, which we could have gotten from 5/9, proving there are two ways to come up with the same number, with one inducing a migraine. That's OK; I got it.
Then, for some reason you plugged .55 into an equation -- not .56 -- and later used a NEGATIVE .22 to arrive at something that resulted in .45, the complement of .55...which you adjust to .44. WHY the .01 adjustment?? THROW ME A BONE, BRO!!! PLEASE.
****Update****: I just noticed in the "proof" portion of video that you changed the ratio of obesity from 5/4 to 4/5 which explains how #s got turned upside down. You just HAD to pick something strikingly similar to the previous example to confuse me, right? But why, Josh? If your videos make 99.999% of the people viewing them smarter and one person ends up smashing themselves in the head with a hammer, can you see how this might be a problem? It reminds me of the class imbalance problem. For a certain audience, your videos are excellent, you're a saint for creating them and it's unfortunate that I am an imbecile. Thank you for reading.
(Only joking. I am getting smarter, just gotta stick with it. Thanks a million.)
Thanks a lot, me and my friends really enjoy ur content.
really appreciate ur content
one of the best statistical video i had ever see
Thank you so much 😀
Hey Josh !
Loved every video of yours
question :i have read many books saying R^2 has a range of -infinity to 1, negative r in the case where regression completely fails to explain varitions among the data , it fails to map it. is this correct ? but you took the range from 0 to 1.
which one is correct?
For linear regression, R^2 can never go below 0. This is because your model can never be worse than the base line model. However, in other settings it is possible to have your model fit worse than the base line model.
@@statquest thanks alot :) !
I watch this series with such commitment as if I were watching a good Netflix series. Just can't stop.
bam! :)
great man
Thank you! :)
Very clear explanation. Thank you!
Thanks! :)
why is it 0.55 and not 0.56? at min 6:47
Ooops. I didn't do a good job rounding! The true value is 0.55555555....repeating, which rounds to 0.56. However, I messed up on the next slide and just put 0.55. Sorry for the confusion.
Josh, I have read that pseudo R2 is not a good metric to compare models which predict the same variable through different covariates (different models built from individual covariates, y ~ x1, y ~ x2, y ~ x3, etc..). What is, in your opinion, the best way to do this comparison?
You can also use a confusion matrix and associated metrics (like sensitivity and specificity and ROC). For details, see: czcams.com/video/Kdsp6soqA7o/video.html czcams.com/video/vP06aMoz4v8/video.html czcams.com/video/4jRBRDbJemM/video.html
Kudos to power kudos to you
Thank you!
13:56 out in the wild R squared value commonly written as
Hello, Josh! Your content is so useful, it’s single handedly carried me through my paper! I thank you very much and hope you continue to post content. Also as a side note, is there no possible way of calculating the correlation of a logistic regression? Any insight is greatly appreciated!
Thanks! There is no way to calculate a "normal" correlation for logistic regression because of the infinite distance between the data and the log(odds) linear fit.
so essentially with a model where weight is a very poor predictor for obese, the best line that we can find will be as poor as the LL(overall probablity), therefore R2 is 0, otherwise with a perfect predictor, LL(fit) is dramatically different from the LL(overall probablity) so that R2 is 1
yep
What does it mean to project data onto the fit line? Thanks for great lessons!
Plug the x-axis coordinate for the data into the equation for the line to find the corresponding y-axis coordinate on the line.
but what are the 2 groups of values on which we perform the chi square in the end? As chi square is performed on groups
In this case we are using a Chi-Square distribution to determine a p-value, but we are not performing a standard Chi-Squared test. This is similar to how a z-test is based on the normal distribution, but the normal distribution is used for a lot more things than just the z-test.
Hey Josh,
Thanks for sharing this. It really helped me clear some doubts.
I have one doubt, how do I find p-values using the chi-squared distribution if degrees of freedom is 10, for example?
It depends on what tool you use. In R, we calculate it with: 1 - pchisq(2*(ll.proposed - ll.null), df=10).
LL Cool J? More like LL "StatQuest is here to stay!" 👍
This is your best yet.
@@statquest Thank you! If you ever want to hear a pun on a particular topic, just let me know.
Great explanations !!!
At 11:06, is it the log( likelihood of the data given the line) or the log(likelihood having this squiggly line given the data)?
I believe it is the log( likelihood of the data given the line)
@@statquest Thank you for the answer.
I thought we were trying to find optimum parameters of the linear equation which would yield in the best sigmoid. Thus finding the MLE of the sigmoid (hence parameters) given the data.
I'll watch your video on the MLE again then. I am still confused with the difference between the two.
@@thomasamet5853 Regardless of how you phrase it, the likelihoods are the y-axis coordinates on the squiggle for each data point.
That helps a lot. Thank you again for taking the time to answer and for the amazing content :)
Hey Josh! Great videos. I have a doubt though. In the first video, you used the intercept and slope of the log-odds graph to show that the p-value is not less than 0.05 (using walds). Here, for the same model, you used maximum likelihood and got a p-value less than 0.05. I don't understand why the two differ.
Is it that using walds is one method and maximum likelihood is another and I'll accept one of the two values?
Thanks.
Your question makes me suspect that you skipped watching Part 2 in this series. Part 2 explains the role that maximum likelihood plays in logistic regression. Hint, maximum likelihood does something completely different from Wald's test. For more details, see: czcams.com/video/BfKanl1aSG0/video.html
@@statquest I went back and rewatched the video. Thanks man!
Thanks both! I have the same qn here: 1) does it mean with one x-variable, the p value of the coefficient (part 1) and p value of the model (part 3) are the same? 2) and if there are more than 1 x-variable, p value of the model (part 3) means if the combined effects of the x-variables are stats sig? Thank you!
Whats R-squared and p ? Do you have a stat quest where ther are explained or mentioned for the first time?
These are great questions. I have a bunch of videos that talk about R-squared and P-values. Check out:
czcams.com/video/5Z9OIYA8He8/video.html
czcams.com/video/2AQKmw14mHM/video.html
czcams.com/video/nk2CQITm_eo/video.html
StatQuest with Josh Starmer thanks :)
Thank you very much Josh for clarifying my doubts. I am doing a logistic regression, and I have 2 questions 1) Why do I get a significant p- Value and I get an r-square of 2 percent for a specific independent variable? If I get a r-square of 2 percent, I should get a pvalue greater than 0.05 (not significant)?
2) How valid that probability equation will serve me? Look residual ?
You can have a terrible R-squared value and still have a small p-value if you have a lot of data. However, if the R^2 value is bad, then, even with a significant p-value, your model may not be worth very much.
I really appreciate the time you take to answer questions !! Thanks, I already have it clearer
In the last part of the lecture, why it follows chi-square distribution when we calculate the p-value? Further, why the chi-square value is determined by 2*(LL(fit) - LL(overall))?? Thanks.
likelihood ratio test converge in distribution to chi-square asymptotically
en.wikipedia.org/wiki/Wilks%27_theorem
It's very clear, thank you ! so the number of degrees of freedom its equal to the number of Xi variables? in this case we have a y variable and only 1 x variable, so we have only 1degree of freedom, but if we have 3 xi variables the degrees of freedom would be 3?
bonus question : how do you compare logistic models ? how can i choose the best ?
Thanks !
The degrees of freedom is the difference in the number of parameters between the fitted model and the overall probability (which typically only has 1 parameter). So if the fitted model has 3 parameters, then DF = 3 - 1 = 2.
People often use the Akaike information criterion (AIC) to choose the best model. For details, see: en.wikipedia.org/wiki/Akaike_information_criterion
13:40
Hello Josh, thanks for making this useful video list so that I can learn machine learning rather than studying in uni. And I would like to clarify sth.
The logistic model you have built has a p-value of 0.03, does it indicate that there is a strong relationship between weight and obesity? Just like what you have said in the video, it is not due to chance.
For the R^2 value, 0.39, does it indicate that the model is not good enough? We may need to add more parameters other than weight to classify whether the mice are obese or not.
Hope you can correct me if I get sth wrong, thanks 😁
The p-value only tells us if the relationship is significantly different from random noise. The r-squared value tells us the strength of the relationship. How "strong" is "strong" depends on the field or area being studied.
So the relationship is significantly different from random noise as the p value is so small. Here, I have one thing to ask, what is random noise?
Though, the relationship is significantly different from random noise, the strength of the relationship is not quite good as we obtain only 0.39.
Do I interpret correct?
@@hang1445 Random Noise is just "random stuff", things that are not related. And if the p-value small, then you can conclude that your relationship is significantly different from random stuff that is not related (and that suggests it represents a true relationship). As for the R-squared value. Depending on the field, 0.39 may be considered a "weak" relationship, other fields might consider it "strong". It depends on the type of data you are working with.
Well explained! Thanks :)
Your videos are very well explained and clearly understandable, your BAM is a huge hugeee plus. I learnt so much via your videos than my grad shcool's ML lectures.
Also, I have a small question. I am new to Machine Learning and also have a fear of it... so anw, can you please explain to me "Why the residuals for Logistic Regression are all infinite?" because the data point is probability so its range is between 0 and 1...? I just can't get my brain stretching out with it T.T
I answer your question in this video: czcams.com/video/BfKanl1aSG0/video.html
@@statquest Thank you so much!!! I will look into that :)
Is LL(fit) the same as the maximum-likelihood? And thanks for your excellent work! 👌
LL(fit) is the log-likelihood of the fitted squiggle. We can use that as input to an algorithm that can maximize the likelihood. To learn more about maximum likelihood, see: czcams.com/video/XepXtl9YKwc/video.html
hi Josh i don't know if you will see this but i had a question how does one know which distribution to compare to determine the p values. Like in the video at 12:01 you said that the metric follows a chi squared distibution but how does one get the intuition fo when to use which distibution to get the coressponding p - value of the metric?
We can use theory to derive the distribution. This is pretty advanced stuff (I did it once a long time ago), so usually we just look it up when needed rather than derive it from scratch.
Thanks for the reply Josh,
Can you give an example of the keywords we may use to lookup the corresponding distribution?
Like i know for testing the coefficients of a linear regression model we use the T-test, but in time-series data, we use the ADF test for checking stationarity. Here the value for the T statistic of a coefficient is to see if it is higher than a certain threshold and based on that we reject or fail to reject the hypothesis. The problem is the threshold that is set here is higher than the one you get if you test it with a normal T-test(I don't know the exact distribution but it follows another distribution).
So how may i go about finding the distribution for testing the statistic in the above case? @@statquest
@@rishavdhariwal4782 To be honest, I'm not sure I understand your question. However, if you are interested in why these specific statistics have a chi-squared distribution, you can look at how Mcfadden's R-squared is derived.
Excellent video as usual. I'm just wondering where the formula 2[LL(fit) - LL(overall probability)] comes from. Please don't bear a grudge against us for asking for further developments, Josh. Your videos are exceptional at making things clear. It's simply, that, the more we learn, the more we want to learn!
BAM! That's a good question and I'll keep it in mind for a future video.
Hi Josh, at 11:39, the arrangement of the red and blue dots on p = 0.44 of the left figure seems incorrect. They should be positioned as follows from left to right: three red dots, two blue dots, one red dot, and three blue dots, as depicted in the figure on the right. This mistake should not impact the overall probability results of LL. Please correct me if I'm wrong. Thank you.
The ordering of the red and blue dots in the left figure at 11:39 is based on the ordering that is introduced at 7:44, when weight has no relationship with obesity.
what if we have a discrete variable instead of weight? how do we find the best fit then?
also would love to see a video on multiple logistic regression!!
This is a good question! Talk about this in "Part 1" and "Part 2" of this series: czcams.com/video/vN5cNN2-HWE/video.html and czcams.com/video/BfKanl1aSG0/video.html
Also, once you understand how parameters are estimated for Logistic Regression, it's easy to see that it works just like like regular multiple regression when you have more variables predicting whatever it is you're predicting.
Thanks! one more (stupid) question. When you convert the probability of obesity to log odds of obesity, the x axis- weight is also converted to log weight? If not then what is the x axis in log odds graph?
Not a stupid question at all. The x-axis stays the same. The parameter (slope) tells you that for every one unit of weight (the x-axis in the original units), you increase (or decrease, depending on the angle of the slope) the log(odds) of obesity (you either go up or down along the y-axis, which is now now in log(odds) units).
In the case of comparing a Ridge vs a Logistic model would R^2 be a good approach?
You would probably compare accuracy or some other metric used for classification.
This may be a silly question, but I'm still confused where the 2[LL(fit) - LL(overall probability)] came from. How do we know to use that to calculate the p-value?
Unfortunately, deriving that equation would probably take a whole video.
Can we also use the maximum likelihood instead of its log version for calculating R^2
Maybe! I don't know off the top of my head. However, the log is often used to avoid underflow errors, so if you don't have too much data, it might work without the log.
I have a question about the p-value. The 2(LL(fit)-LL(overall)) a point estimation for the probability of this value. So Chi f( 2(LL(fit)-LL(overall)) ) just give us the probability of this single value. In your example f_{\chi^2}(4.82) \approx 0.0163. So to get the actual p-value we need to use: 1 - F_{\chi^2}( 2(LL(fit)-LL(overall)) ), which is the area of the right tail where x > 2(LL(fit)-LL(overall)). In your example, the actual p-value is approx 0.0281. Am I right?
That seems correct. I rounded the value to 0.03.
the squiggle line is the best fit line right? which is -3.77. but in the later part of the video you take -6.18 and say it a LL(FIt). But that is LL(overall prob). Why is that so?
There is a lot in this video, so can you tell me what time point (minute and seconds) is confusing you?
@@statquest Check the video at 5.18(LLfit) , 6.51 (overall prob) and 8.41 (LLfit)
@@TheRamnath007 OK, so in this video, I use three different datasets to demonstrate how to calculate the R^2 value. For the first dataset weight is correlated with obesity, and I calculate LL(fit) = -3.77 and LL(overall) = -6.18. Then I calculate the R^2 = 0.39 at 7:25 . Thus, the R^2 confirms that weight is correlated with obesity. After that first example, I then create a new dataset that does not have a correlation between weight and obesity. I then calculate LL(fit) and LL(overall) for the new dataset. In this case, both LL(fit) and LL(overall) = -6.18. I then plug this number into the formula for R^2 and get R^2 = 0 (see 9:22 ). So the R^2 confirms that this new dataset is not correlated. After the second example, I then create a new dataset where there is tons of correlation between weight and obesity. I then calculate LL(fit) = 0 and LL(overall) = -6.18 for this new dataset. Lastly, I calculate R^2 and get 1 (see 11:26 ). My guess is that the thing that is confusing is that the number -6.18 keeps coming up in each example. This is because each made up dataset for the three examples has 4 obese mice and 5 mice that are not-obese. This means that the LL(overall) will be -6.18 in all three examples. However, it also means that LL(fit) = -6.18 in the second example because the data are not correlated and the best fit is a horizontal line at the log(odds), just like LL(overall). Does this make sense?
Hi Josh - appreciate your videos! I'm curious why you say that R squared only goes between 0 and 1, when it can go between negative infinity and 1. Any model can have infinitely poor fit - leading to significantly worse residuals than the mean's residuals. While this indicates your model is terrible, in the off chance that it happens (which it has for me), it would clear up any ensuing confusion that something must be broken with your programs. Thanks!
Yeah, it's possible to have negative R-squared values. However, typically with Logistic Regression we compare "nested models". In other words, one model is the "simple model" and the other, the "fancy model", contains all of the variables in the "simple model" plus others. When this is the case for Logistic Regression, the fancy model can not do worse than the simple model because otherwise the parameters for the new variables would be zero (or not significantly different from zero), and thus, in the worst case, the simple model = the fancy model, which results in an R^2 = 0. However, when you don't use nested models, or you are working with something other than logistic regression, you can get negative values.
Hello!
At the 8:24, you can determine the maximum likelihood with the intercept of -0.22.
How can you know that?
Which line do we have first? squiggle line OR straight line?
I do not actually understand that at the beginning, we already had a squiggle line, then found p values of points to calculate log(odds) in order to get the straight line of the log(odds) graph. How did we have that squiggle line at the beginning?
OR, we already had a straight line, then projected points to find the log(odds) values, next, calculated the p values in order to have the squiggle line. How did we have that straight line at the beginning?
I AM STILL CONFUSED ...
To learn more about how we fit lines and squiggles to data in logistic regression, see: czcams.com/video/BfKanl1aSG0/video.html
10 different ways to calculate R squared? I'm just curious what they are so I can look them up. I can only find 4. McFadden's is the only one that seems to make sense to me since it's close to the linear models (presumably why you chose it), but I am curious as to what are all the ways to do it.
Mittlbock and Schemper (1996) “Explained variation in logistic regression.” discuss *12* different R-squared formulas for Logistic Regression: citeseerx.ist.psu.edu/viewdoc/download?doi=10.1.1.477.3328&rep=rep1&type=pdf
stats.idre.ucla.edu/other/mult-pkg/faq/general/faq-what-are-pseudo-r-squareds/
@@janinajochim1843 Thanks!
BAM!!!
:)
Hi there!
Thank you for this fantastic video! I've been struggling to understand the outcome of the pseudo-R square in my model and what this means for me to proceed. For McFadden's R-square, I got 0.03 for my final model. Whilst the internet tells me to be 1. Careful with the interpretation 2. That a score of 0.2 - 0.4 is desirable and that 3. The interpretation is 'not the same as for OLS R-square' and 4. That pseudo R-squares are smaller in general than OLS R-squares, it doesn't really tell me where to go from here. How bad is 0.03? Can I still interprete my odds ratios or do I need to re-specify my model? There is no doubt that I am lacking relevant variables in my model, however, none of them were assessed in the study! Thank you so much in advance (PLEASE HELP ME!!!!).
* I should have also added that I have multiple IVs in my model and 3-4 of them are significant. I wonder to what extent I can interpret them as important predictors regardless of high R-square
0.03 seems pretty small to me, and thus, despite the significance of the independent variables, they do not give you very much information about what is really going on with what you are trying to model.
:C
@@statquest The promised funny story:
Recently overheard two of my fellow students having the following exchange:
Student 1: I am not sure what to do over the summer
Student 2: Mh ...
Student 1: Was thinking about doing some modelling
Student 2: Oh cool. What like for magazines?
Student 1: What?
Student 2: You didn't mean on catwalks, right?
Student 1: What? I meant with my mice- data!
@@janinajochim1843 That is great!!! Very funny. I got a big laugh out of that. :)
Hi, do you have any instrutions of multinomial ordinal logistic regression ?
Not yet.
@@statquest I can not find its content on internet I have been beated by this statistic ... most of academics usually teach about binomial one
@@henri9289 Noted
@@statquest I have searched for content on both internet and library, I have only found binomial's equations... Iam looking for multinomial in order to write the equations on my dissertation
If my model has a high p-value (x variable is not correlated to y) but has a high R-squared value (meaning the variance in the y data is explained by x = our line fit our data well) what does this tell us? How can x be not related to y but at the same time our y's correspond to correct and reasonable values for x?
If we only had 2 data points, then we could get the squiggle or line to fit them perfectly, resulting in a high r-squared. However, any too random points will result in a perfect fit (just connect the two points), so the p-value will be terrible. Thus, one thing the p-value can tell us is how much data supports the r-squared value.
The data i'm work in it makes nonlinear system Ax = y, then i used PSEUDO-INVERSES instead of maximum likelihood to find the parameters that give us a best fitting line.
Thus, the pseudo-inverse provides the optimal solution to the least-squares problem.
Mr. Josh, What is your opinin? if there is any wrong in my work tell me Please.
Thanks in advance.
No answer 🙁‼️
I've heard that we can not apply LSE to find the best fit in logistic regression and honestly, yet I don't know why? (When it comes to log(odds) I know that residuals are infinity and we can't) but why don't we simply assume that our data is only 0 or 1 and simply use LSE just like linear model to find best fit. i.e. we have data that are obese (1) and not obese (0) and we use logistic regression with specific threshold (0.5) to predict 0 and 1's and then we define cost function and try to minimize it?
It's actually possible to use the sum of the squared residuals, but it doesn't always work as well. To learn more see: czcams.com/video/6ArSys5qHAU/video.html (NOTE: To understand what is going on, just replace "cross entropy" with "log(odds)")
Can you do the linear and logistic regression in matrix form please
I go through design matrices in these videos: czcams.com/video/NF5_btOaCig/video.html czcams.com/video/CqLGvwi-5Pc/video.html and czcams.com/video/Hrr2anyK_5s/video.html
@@statquest Thank you!
Are there any videos on Bayesian Networks?
@@tamerosman774 Not yet.
Hi Josh, could you also please explain the loss functions?
3:09 I, think worst fitting line perpendicular to the best fitting line
You are correct - I should have been a little more careful with my words at that point.
I had a doubt, that in logistic regression what does this R square value actually tells? In Linear regression it used to tell the amount of variance explained by our model. How do we interpret it in Logistsic regression? Is it really helpful in logistic regression or we can just skip it's interpretation?
Umm... this whole video is intended to answer your question. Is there a specific time point that is confusing?
@@statquest I was reading a article on google and it said that R square in logistic regression is not used to tell the explained variance but rather the improvement in model likelihood over null. I wasn't able to relate with this video. Just wondering what actually it reresents in logistic regression.
@@anshulsaini5401 I guess I don't understand the question since this video, and the article on google, say that the R^2 is the improvement in model likelihood over the null.
Shouldn't it be 0.56 instead of 0.55 at 6:46? Or did I misunderstand?
You are correct. That's a typo. Sorry for the confusion.
Sir how do we calculate the intercept and slop for logistic regression ? Please tell me with example
We use maximum likelihood and gradient descent. For an example, see: czcams.com/video/BfKanl1aSG0/video.html and czcams.com/video/sDv4f4s2SB8/video.html
Sir ,can't we calculate the slop and intercept to logistic regression without using gradient decent?
@@narendrasompalli5536 There is not an analytical solution, so you have to use some iterative method. Gradient Descent is a popular method, but there are others you could use.
Sir i said that we can calculate the best slop in linear regression by using sum((x-x bar) (y-y bar)) /sum(x-x bar) ^2
Like that can't we calculate in logistic regression!? Sir
and why is it 0.44 and not 0.45 at min 8:37? :'(
Again, this is just poor rounding on my behalf. The true value is 0.4452208, which rounds to 0.45.
What about the assumptions of a logistic regression which must not be violated?
In log() space, you want to have a linear response.
@@statquest But this linearity must be checked only if the predictor is continues right? Is there anything to check for categorical variables?
Also thanks for responding.
I love you.
:)
"Wow, that was a long sentence" 🤣
:)