CUMULATIVE FREQUENCY CURVE (OGIVE) FOR GROUPED DATA - 2020 WAEC WASSCE EXAM

Vložit
- čas přidán 1. 07. 2024
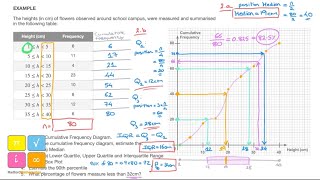
- In this video, Question 10 of the 2020 WAEC WASSCE Maths Theory Question is well treated on the cumulative frequency table with the OGIVE curve being used to further estimate the Median of the Grouped Data.
For more content like this, subscribe to the channel and share the video on your social media as we build excellence in students in the STEM subjects.
Subscribe to Davetuts Academy by clicking here: czcams.com/users/davetutsaca...
MORE VIDEOS & PLAYLISTS FROM DAVETUTS ACADEMY
==============================================
2020 WASSCE WAEC Maths Exam Prep
• WAEC WASSCE 2019 May/J...
Chemistry Practicals Exam Prep
• WAEC WASSCE (PC2) GCE ...
WAEC WASSCE Maths Syllabus + Mind Map
• WAEC MATHS MAP - ALL Y...
** THIS VIDEO BY DAVETUTS ACADEMY IS SOLELY MEANT FOR EDUCATIONAL PURPOSES ALONE. YOU ARE FREE TO SHARE ON YOUR SOCIAL MEDIA FOR EDUCATIONAL USE BUT YOU ARE NOT PERMITTED TO RE-UPLOAD ANY PART OF THIS VIDEO. COPYRIGHT CLAIMS WILL BE FILED AGAINST YOU IF YOU DO! **
#waec #WASSCE #GCE #NECO #JREE #home schooling #remote learning #waec past questions and answers #exam preparation #gre #practice test #gcse #gre Exam #STEM4Lagos
Highlights of the video include:
0:00 Welcome to Davetuts Academy
0:08 Problem statement
1:17 The Cumulative Frequency Table
5:36 Scaling the Graph for Data Entry
13:09 Extrapolating the values for the x and y axes
18:09 Plotting the Cumulative Frequency Curve
18:32 Evaluating the Median Mark
20:52 Finding the Least Mark for Distinction
23:30 Overview


Sir you really saved me .God blesses you.
Ameeeen. Thanks for the feedback, Godsway.
You can check out more Graphical Solution to Mathematical Problems here: czcams.com/play/PLl3TIo4r2HuN64YJg2ejVOGJdB9l_lkbN.html
Dude better than my teacher😊 thanks sir
Thank you very much! This was really helpful ♥️
Thanks very much highly beneficial 🥰
Thank you very much, Sir!
Thanks very much😊
Thanks a lot
Thank you so much 😇😇😇
This was so real easy ....
And so shall your success be easy too!
Thanks for the feedback
Thanks so much you saved my statistics
👝
Mission accomplished!
You are welcome
sir pls the meaning of the 5 divisions,,i dont understad..u said each box is divided into 5 divisions ..how pls
Well explained
Well explained
God bless you sir
Ameeeeeeeeen
🙏🙏🙏
Thank you sir
Watch Mathematics Exam Prep here: czcams.com/video/U_cHam0p4UE/video.html
MORE GRACE SIR 🔥🔥🔥
Sir a quick question its not part of the workings in this video its just a personal question relating to calculating quartiles and percentiles : so like if we end up getting a decimal after calculating 25%of50 do we round up the 12.5 to plot on the graph or u put it as 12 on the graph. Its just that im solving a question like that. Thank you Sir ❤❤❤
You need to factor it into ur graph.
I your scale puts 12 and 13 on unique sequential graph lines, then you locate the space between them.
But if the scale puts 12 and, say, 24 on sequential lines, you have to use the 12 approximately.
God bless you
Ameeeen
Weldone, but this graph sheet is 1cm not 2cm
Thanks Tambuwal. You should understand it's representative. Making best use of the digital space warrants the scaled adjustment. But the prep for K12 students warrants staying in the bound of their understandable scope.
Students get it and it's obviously stated in the video too
Sir do u solve chemistry theory questions
Not yet; maybe later.
👍
Thank you Sir...
You are welcome, Rose.
Sir do u do physics topics too?
Yes. Check out our general exam preps here...
PHYSICS EXAM PREP: czcams.com/play/PLl3TIo4r2HuNuX-EjigK2w7Gk-b2Tlo5A.html
Please do you do chemistry
CHEMISTRY: czcams.com/play/PLl3TIo4r2HuM0uPBknQzC9dirqrJoHEqk.html
Can we just mark the origin of the graph as 0.5 instead of 0. It's kind of hard to see what you wrote on the x axis to indicate that your origin doesn't actually start from 0
No please. Just draw two "W" that is sitting directly on the thick red line starting from the origin and that will be fine. All the best
Sorry what if u have yr cf up to 360
Continue with the same concept and scale the graph to cater for all the values as appropriate
You are a darling sure♥️
I dnt understand how u got the 95/100
Letter C the 5% distinction
It's gotten by subtracting the 5% that got distinction from the 100% which is the total of them all. So we have (100-5)% = 95%
@@DavetutsAcademy where did you get the 100 percent
Great Man, a complete data set will be considered as 100%. Other percentiles are scaled from it subsequently. Hope it's clear.
@@DavetutsAcademy yes sir
Your graph 📉 is just the requirements