Plotting SEM Error Bars in the NEW Sheets

Vložit
- čas přidán 7. 07. 2024
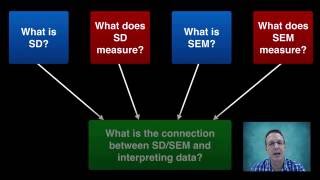
- This updated video demonstrates how to use the New Google Sheets to calculate the mean, standard deviation, and standard error of the mean for a few data sets, and then how to plot those with error bars representing 2SEM