How to build dynamic MTD/YTD Slicer | Power Bi | Data Analyst

Vložit
- čas přidán 19. 07. 2024
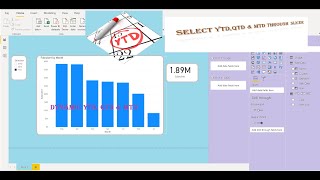
- How to build a dynamic filter that can filter the whole page or report based on MTD/YTD
#businessintelligence #powerbideveloper #power #powerbiservice #sqlserver #dataanalytics
#powerbi #microsoft #businessintelligence #excel #dataanalytics #datascience #data #tableau #datavisualization #sql #dashboard #office #analytics #python #business #dynamics #bi #software #bigdata #digitaltransformation #azure #dataanalysis #powerapps #machinelearning #technology #dashboards #microsoftpowerbi #o #cloud #businessanalyticscourse
#powerbishorts #powerbideveloper #powerbitutorials #powerbitutorial


Whatta amazing explanation.
Nice 👍
Nice 👍👏
Nice
can we use
YTD & MTD function directly instead of startmonth & year function !
How do you do that moving bar along the top???
I need to know now hahaha!!!
I used a custom visual here. You can also find it just search for Scroller.
Hi Sir, thank you for your sharing. The method is really simple and clear. However, this slicer seems doesn't work on visuals that contains last year's data.
I have a clustered column chart that contains this year and last year's column. When I click the slicer, it works perfect with this year's column, but last year's column just disappear. Do you have any suggestion to fix the problem?
thank you very much
You can use a measure to show last year data along with current year. In last year calculation you can ignore current MTD/YTD filter or you can filter it based on month and year only.
Hi, thanks for the post..Wer you able to fix this? I also have a similar issue and getting blanks for LY data column.
getting error