Spotlight Visualization in Excel (Part-1) | Dynamic RAG (Red, Amber, and Green) Stoplights

Vložit
- čas přidán 13. 09. 2024
- #Infographics #Spotlights
Hello Friends,
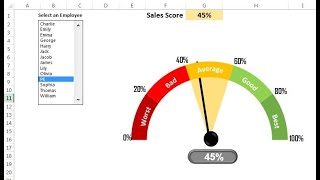
In this video, you will learn how to create beautiful spotlight visualization with RAG (Red, Amber, and Green) color. We have used Excel shapes and to change the color dynamically we have used Name Manager and Linked Picture.
Spotlight Visualization in Excel (Part-2)
• Spotlight Visualizatio...
Click here to download the practice file:
www.pk-anexcel...
Download our free Excel utility Tool and improve your productivity:
www.pk-anexcel...
See our Excel Products:
www.pk-anexcel...
Visit to learn more:
Chart and Visualizations: www.pk-anexcel...
VBA Course: www.pk-anexcel...
Download useful Templates: www.pk-anexcel...
Dashboards: www.pk-anexcel...
Watch the best info-graphics and dynamic charts from below link:
• Dynamic Graphs
Learn and free download best excel Dashboard template:
• Excel Dashboards
Learn Step by Step VBA:
• VBA Tutorial
Website:
www.PK-AnExcel...
Facebook:
/ pkanexcelexpert
Telegram:
t.me/joinchat/...
Twitter:
/ priyendra_kumar
Pinterest:
/ pkanexcelexpert
Send me your queries on telegram:
@PKanExcelExpert
************ Suggested Books ********
VBA: amzn.to/2TMMikX
Excel Dashboard: amzn.to/2WZi2Fj
Power Query: amzn.to/2Ibd7xR
Power Pivot and Power BI: amzn.to/2DCg8BB
Exam Ref 70-778 (Power BI): amzn.to/2GnWYTN
************ My Stuff ***************
Mic : amzn.to/2TLnF88
Video Editor: screencast-o-m...


Excelente trabajo.
¡Muchísimas gracias!
Gracias por ver
You are awesome PK, Love it mate, you really are the best excel teacher 🤗
Thanks for your valuable feedback
Dude thank you soo much, spot light is soo useful for me to indicate the idle time & production backlog in my office, please make more video regarding this.I'll study a lot from you..
Thanks for your valuable feedback. I will definitely try to make such video series
Your canal is the best .. congrats
Very good, beautiful. Thank you!
Thanks for your valuable feedback
I really like this, looks amazing, thank you
Thanks for your valuable feedback
thanks for your informative content.
My pleasure!
You are an excellent being on excel
Thanks🙏
You are the best! I am a big fan of yours!
Thanks for your valuable feedback
Its fantastic.... You are a master....... Best Regards from mexico.
Thanks for your valuable feedback
Awesome and unique idea Sir .
Thank you sir
Thanks for your valuable feedback
Brilliant!!! Very...Very Good... Impressive... Tks for sharing...
Thanks for your valuable feedback. Request you to please share this with your friends and colleagues.
I love your ideas, unique!!! Thanks for sharing :)
Thanks for your valuable feedback. Request you to please share this with your friends and colleagues.
Amazing video... I hope l can replicate it.. for my report. Thank you again, Sir.. I'm an avid fan.. .
Thanks
thanks so much i learn new things. thanks again.
Thanks for your valuable feedback
U R A Master of charts and dashboard thank q sir
Thanks for your valuable feedback
Thnks you very much. I'll hope study a lot of from you🥰🥰
Thanks for your valuable feedback
Amazing, you really know your way with graphic options of excel! Superb :)
Thanks for your valuable feedback
You are not an expert You are an excel genius and scientist
Outstanding, boss!!!
Very useful tutorial
Thanks for your valuable feedback
Very impressive PK, thank you
Thanks for your valuable feedback
amazing stuff and waiting for next parts
Thanks for your valuable feedback
Big brother i try this. Not same but i made it. Thank u so much.
Thanks for your valuable feedback
@@PKAnExcelExpert but i have a query when you turned the base face in ul side so the yellow color remains same. Not turned accordingly. Please suggest me?
You are doing a good job buddy! Keep it up
Thanks for your valuable feedback
Thank you so much 💕
Most welcome
excellent...............
Thanks for your valuable feedback
i don't how i thank you my best brother and helper
Thanks for your appreciation
Excelente... saludos desde Colombia.
Thanks for your valuable feedback
Wao sir .....so nice of you
It's my pleasure
Amazing!
Most welcome🙏
Awesome 👏 sir!!! looks great....
Thanks for your valuable feedback
master show!
Thanks for your valuable feedback
Perfect video thank you very much
Thank You so Much
Most welcome🙏
Most welcome🙏
Brilliant trick PK! You're just awesome bhai!!😂
Thanks for your valuable feedback
Click here to download the practice file:
www.pk-anexcelexpert.com/spot...
????
Wooooow😳😮😮
Thanks for your valuable feedback🙏
Awesome pk
Superb
Thanks for your valuable feedback
Thank u very much
Thanks for your valuable feedback
Keep it up bro... 👍👍👍👌👌🤟
Thanks for your valuable feedback
Beautiful 💖
Very nice Bhai saab 👌👌👌👌
Thanks for your valuable feedback
@@PKAnExcelExpert welcome Bhai saab bahut mast video banate ho yaar
Awesome
Thanks for your valuable feedback
Super ♥️👌
Thanks
Wow awesome bro
Thanks for your valuable feedback
Master show!! 😍 I love it 😍💙
Thanks for your valuable feedback
Good.
We will watch the 2nd part of video.
Gracias por ver aur gracias video.
This video I liked
Great
Thanks for your valuable feedback
This is awesome!
Thanks for your valuable feedback
so good
Thanks for your valuable feedback
Greta, bravo
Thanks for your valuable feedback
Nice
Thanks for your valuable your valuable
ur the best
This is so awesome
WOW PK ♥
Thanks for your valuable feedback
Doesn't appear to work in all versions of excel. Using excel for Mac v16.71 and it does not allow you to copy the finished spotlight to the data page with all the formats in place. Also not allowing you to link to the data to change colours. Still very interesting video on how to be creative with your outputs.
There is no bevel option in my excel
Can this apply to a pivot table with slicer? Thanks.
Can we make this type of design in any of the excel version?
pretty cool :-)
Thanks for your valuable feedback
Cool video.
Like it.
Link given on description box in Your Link??
Hi Pk,
Thanks in advance.
I have 5 laksh recrods are there I need to apply vlookup formula using VBA I am applying it's taking to much time and also hanging the excel application is there any way to doing fast vlookup kindly help this
Dear sir I have a doubt, in this project since I executed it for my office project and getting outlines, I utilised no outline options but still i am getting it. Kindly advise?
Me encanto
Excuse me but i didnt understand randbetween function. what was it for?
सर हिन्दी में भी वीडियों बनाइये please
Can this be done in Google Sheets?
Sir. Jab hum "="sign press krke "service -level" likh ke enter Press krne se "service not valid "aa raha hai
😀
Thanks
But sir its not running in my excel
His ideas and tricks are good however he works so fast in some cells that when you follow his downloaded file and watch the video again, you can't always get it right.
Plz help sir
waste of time