Downloading ESRI 2020 Global Land Cover Data

Vložit
- čas přidán 6. 09. 2024
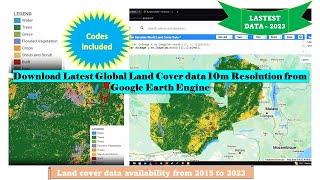
- In this tutorial, we will discuss about the new Global Land Cover Dataset which was released collaboratively by ESRI and Impact Observatory institute. If we look at the background of this dataset, it is making use of the multispectral images produced by Sentinel 2 satellite (2020) to derive this land cover data via a deep learning artificial intelligence classification model. This land cover product has a spatial resolution of 10m x 10m, and the land cover types are categorized into 10 different classes; Water, Trees, Grass, Flooded Vegetation, Crops, Scrub/ Shrub, Built Areas, Bare Ground, Snow/ Ice and Clouds.
Web-link: livingatlas.ar...
#esri #landcover #sentinel2


Very informative video. I m from Maharashtra Forest Department India. Very useful for our project. Thanks sir
You are sent from heaven ! Thank ya bro
You are a life saver.Thanks. Love your voice.
You are so welcome!
Thank you so much, Sr was really helpful and clearly mentioned the path of how the land cover data is downloaded from the global data set and how the analysis was performed through GIS software.
The shapefile which I want to overlay is much bigger than the size of raster file and covers the total raster file...means it is not supposed to be fixed as it is taught by u...
Thanks for sharing this information 👍
Hi, thank you for sharing this very important tutorial. I have followed your instructions to download and make land cover map of my study area. However I am facing a problem, actually my study area lies in two different tiles. When I tried to mosaic them in ArcGIS then I get image have 3 bands and I can't perform land cover change analysis. Please guide me how can I mosaic two different tiles if Sentinel 2 land cover map in ArcGIS?
Excellent presentation
Thank you very much for this tutorial! I just have a question about making a map out of it. Well, we all know that the raster has been coloured in 10 different categories, so I wanted to show them in the legend while making the map in ArcGis. But, I couldnt see any information about what each colour represent in any sort of attribute table of the LC raster. Is there any solution for that if you know ? :))
I've that doubt too
take care there are several errors and mixed classes ....lithology with the urban area and so on ....roads and building shadow with vegetation
Thanks for the explanation! This is very helpful!
Thank you! Cheers!
Thank you Sr for this incredible data sharing
You are welcome :)
Thanks for the valuable explanation!
Thank you.
You are welcome :)
Thanks for sharing this information
You are my hero!
Thank you for your share this information.
thak you so much for an interesting explanation
Thanks a lot for exposing your expertise!Sir can we use this land cover data for RUSLE soil sedimentation analysis.
Thanks a lot Sir, grateful if you make a detailed map of the tiny island of Mauritius please
Very helpful. Thanks
Very helpful. Thank you.
You are welcome :)
muchas gracias por compartir la info
You are welcome :)
Thank you so much, Sr i am facing a problem our study area is covering into two tiles, i tried to mosaic them but it give me the error is there any way to mosaic them together these two tiles of ESRI Global land cover data.
Amazing. Thanks
i am doing the same in qgis though different location after i have clipped (clip by mask) i am getting a different color of white and black any help please
Hi! Thank you, the links were helpful and it helped me understand how to use the site as I was really confused! Please forgive me if this is a stupid question, but is there a source for more time-specific data? These are composites of whole years, but I am looking to find smaller time intervals as my study ranges August 2018 - April 2019? Thank u!!
You may look into using Landsat or Sentinel data, however you will have to perform the lanscover classification by yourself.
Thank you so much. ✌
Thank you
Hello sir, i donot have the "access the map" option in the link you provided, so what do i do ?
thank you very much but I have An error when I chenge DEM to slople the defoult Z value is shows warrning sign what can I do ?
Hi Man, Thanks for keep sharing your expertise! May i ask you how to make NETCDF file from shape file with Python?
what types of data do you need to convert NETCDF to shape?
@@ehsanulbari6933my question is change shape file to Netcdf file, not netcdf4 to shape file, we can manipulate netcdf file with R or Python.
Someone please tell how to change grd. file into shape file?
Sir, please make a video that how can we use ArcMap in archeology? "
Is it possible to download time series data?
This dataset is of year 2020.
If you would like to inspect the temporal changes, I would suggest you carry out your own landuse classification using landsat/ sentinel data which you can download for the times periods that you are interested in.
@@geodeltalabs Thanks a lot
How should I merge such multiple raster datasets without using Mosaic to N.R.
You're the best
Thank you :)
What if I reproject the ESRI Raster layer rather than my shape files of the study area? Sorry, I am just a beginner novice in GIS and I had to ask.
How to combine dataset if the country is separated in two grids
I have same question, how would we combine if our area extends over multiple tiles?
I have tried mosaic to new raster tool in arcgis and it works
FOLLOW my IG for more! @rational_cartographic
I mosaicked using creat new dataset and it worked fine, mosaic to new raster took way too long.
@rational_cartographic🙃
Thank You ..
You're welcome
Sir how to create lulc map project in this data,I mean how to add legend table,, please sir reply
hello I was followng your tutorial but it shows me the following message "The provided maps are not for purchase or for download; it is to be used as a guide for reference and search purposes only." and i need land cover data for Chile , f you can help me it would be really nice
From which website did you download belgium shapefile?
I would like to say thank you for all your support, please sir I need an introduction about Kite editor??
what can i do if my shape file is located between two downloaded land cover tiff
Mosaic (Join) the two in ArcGIS
how to give legend
is data for the past 5 years available on esri
For this I think you can make use of Landsat and sentinel data. However you will have to perform the classification of landcover types by yourself.
Can i change the symbology ?
Is it a raster?
Yes :)
Sir i am nt able to clip my data
I have tried many times
What's the error message you get?