Pareto Analysis Chart In Excel Hindi

Vložit
- čas přidán 5. 09. 2024
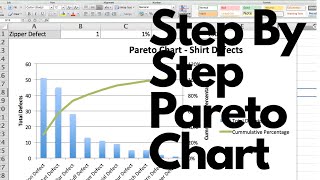
- Learn to do Pareto Analysis and Create Pareto Chart in Excel in Hindi. Pareto Analysis is a technique used for decision making based on the Pareto Principle, known as the 80/20 rule.
It is a decision-making technique that statistically separates a limited number of input factors as having the greatest impact on an outcome, either desirable or undesirable. Pareto analysis is based on the idea that 80% of a project's benefit can be achieved by doing 20% of the work or conversely 80% of problems are traced to 20% of the causes.
To Buy the MS Excel Course please visit www.myelesson.o... or call 975-200-3788 10 Most Used Formulas MS Excel
• 10 Most Used Formulas ...
Learn Basic Excel Skills For Beginners || Part 1
• Learn Basic Excel Skil...
10 Most Used Excel Formula
• 10 Most Used Excel For...
*Most Imporant Excel Formuls Tutorials*
Learn Vlookup Formula For Beginners in Excel
• Learn Vlookup Formula ...
5 Excel Questions Asked in Job Interviews
• 5 Excel Questions Aske...
Create Speedometer Chart In Excel
• Create Speedometer Cha...
Learn the Basic of Excel for Beginners || Part 2
• Learn the Basic of Exc...
Create Pareto Chart In Excel
• Create Pareto Chart In...
How to Create Dashboard in Excel
• How to Create Dashboar...
Excel Interview Questions & Answers
• Excel Interview Questi...