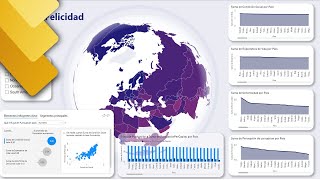
Three VISUALIZATIONS you should KNOW and USE in POWER BI. Step by step and in minutes!

Vložit
- čas přidán 29. 07. 2024
- What's Up Guys! In this video I will teach you how to create three graphs to turn your data into visual tools that are easy to understand and have a great design for your reports in Power Bi. We will initially work on a string graph to analyze interrelated data from a third group of data; We will also learn how to make a ribbon graph to easily identify changes in variables and finally we will make a multilevel concentric circle graph that will facilitate the analysis of hierarchically segmented information.
See you in a next installment. Diana
#powerbi #microsoft365 #tutorials


Gráficos muy útiles, bendiciones!
Informacion de primerisisisisisma calidad, gracias por compartir ¡¡¡¡
Gracias, se ven muy bien.
Excelente información. Veo que la visualización de Sunburst es un gráfico de proyección Solar de Excel mejorado. Muchas gracias.
Muy bueno. ¿Tendrías el ejercicio para descargar y practicar?. Muchas gracias y un cordial saludo
Para practicar puede facilitar la hoja de Excel?
HOLA ME PODIRAS AYUDAR CON EL CVS
Tutorial de PowerBI sin enlace a los datos.