How to Do a Runs Test in MS Excel 2007

Vložit
- čas přidán 11. 09. 2024
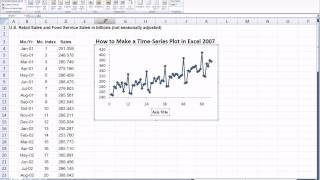
- This video shows you how to do a runs test in the basic package of MS Excel 2007 (i.e, without an Add-In). The purpose of a runs test is to determine if a set of binary data collected over time is random or not. The data I used represents the natural gas used in my home on a daily basis over a period of 30 days - starting near the end of January and ending near the end of February. The units of gas are in 100s of cubic feet.


WOW! I struggled for about 2+ hours today trying to calculate a p value for my CONNECT hw. FINALLY, I found your video and I actually determined the right p value. Cheers!
Excellent presentation. It really helps me in my research. Thank you so much.
Mohd Younus
Research Scholar,
Osmania University.
Hyd. India.
Mohammed Younus me too
Note: 4:52 "I know R is 10". He is talking about the number of counting runs. Excel would do that calculation for you with COUNTIF(E4:E34, 1) because each 1 in column E counts as a new run.
It was a very nice, instructive example, thank you very much.🙏🙏
Thank you very much for your video. It was very easy to understand and follow for such a complicated equation!
you sir, saved my life, congratzz and thanks!!!!!!!!!!!
With your data, I calculated Z = -30.304 and the corresponding two-tailed p-value is 1x10 to the minus 201 power (a very small value). Stock prices tend to have far fewer runs than expected for a random process and because you have such a large data set, you get a big z-value and small p-value. Stock prices definitely do not follow a random process.
There's a slight error in your Z calculation and therefore p-value. Because you are dealing with binary data and not continuous data, the continuity correction needs to be implemented. That is Cell H11 needs to be (H4-H8-SIGN(H4-H8)/2)/H10, not (H4-H8)/H10. This changes the p-value to 0.0834.
@nichtschwimmer0605 Yes, that sounds right. So, you were trying to see if the index follows a random walk by seeing if the index returns follow a random process? A random walk has differences (price changes) that form a random process, but not necessarily returns (price change over previous price).
There are some variations of the Runs Test. Most common is to use the mean, but the median may be preferable if you have outliers in your data. It's fine to use the Runs Test on returns. Keep in mind this is an unsophisticated statistic for testing randomness. You might look into autocorrelation. You can use the Runs Test on weekly data.
I think it's right in the video. I followed the order of operations, so given the denominator is N^2*(N-1), dividing the numerator by N^2 and then again by N-1 gives the same result as dividing by [(N^2)*(N-1)].
very nice presentation. would just suggest to use the count() and countif() functions to count observations. Thanks for sharing!
Excel has a function called normsdist() that I used in the video which returns the area to the left of the argument in the parentheses (in your case Z = 2.58). You want to find the area to the right of Z = 2.58, so you should find 1-normsdist(2.58) = 0.005 approximately. Then, multiply that value by 2 to get the two-sided p-value of about 1%.
By the way, you are analyzing returns, not prices, right? It's surprising you ended up with significantly more runs than expected for a random process.
Generally, stock prices follow a random walk, so their differences would form a random process. Over longer time periods, stock prices may show increases in variation (violating the random walk model form), so transforming them into natural log units (almost equivalent to calculating the returns) puts them back into the random walk form. Then, the differences of the transformed series should be a random process.
Hi there,
I really appreciate your help by posting this great video. I do have a question. Once I get a number of p-value. what does that mean. How can i know this is really random or not that much. How can I know how the randomness is?
thank you so much. it really help me a lot..
Hi, does someone know the reference of the book with the formulas? Really needed that to justify the usage of this technique. Thanks
@lordjoesnow You should use a two-sided p-value if you're not sure - before collecting your data - whether you would have fewer or more runs than expected for a random process. Some returns have a slight positive autocorrelation over time, so you could justify a one-sided p-value (assuming there'd be less than expected runs compared to a random process).
First, find the area to the right of z = 1.29696 under a standard normal curve. The answer is 0.0973. If you did a one-sided test (where the alternative hypothesis is "the process has more runs than expected for a random process"), then the p-value for the test is 0.0973. Since that value's greater than the typical significance level of 0.05, you would not reject the idea that the process is truly random. The 2-sided p-value is 2*0.0973 = 0.1946 which is > 0.05, too, so don't reject random.
So cool. So cool . Thanks
@ProfTDub So, would you recommend to use price changes rather than returns for the RUNs test? Additionally I computed serial correlation coefficients for index and companies' returns. Independent from answer to question one, would you recommend to use price changes in terms of that test for autocorrelation?
hey, the wiki page says that we use the median rather the average? Also im using this method on ln returns? is that advisable?
my z values are figures such as 1.29696011 and for another ln returns series i have 0.31624858 and then another has a z of 0.62716022. These are all positive so i minus 1 from them but my first value is still positive. Do you think maybe i made a mistake in the calculation? that particular series has 189 runs when its expected was 176 so i'd expect that it isnt particularily random but can't figure out what the z values are saying or how to get the correct p value and what that means
-not sure what you mean. If your raw data is not in binary form, and it is a left-skewed distribution, that doesn't matter in calculating the runs test p-value. In the video, I had fewer runs than expected for a random process - leading to a negative z-value, but there could be more runs than expected in some data - leading to a positive z-value.
What about not using averages but simple positive or negative variations? In this case the diference of the lograythm of the price.The test for randomness in gretl gave the same outcome but slightly diferent values for p and z. Nice video, very helpfull.
Yes, I'm analyzing returns! Was surprised as well, but for both examples, German Dax over 3 years daily returns and a German share over the same period, the results are more runs than expected.
I would interpret Z=2,58 and the other which is Z=0,58 as follows: at a significance level of 5% Z should be between -1,96 and +1,96 (following Z table) Index return doesn't follow random walk, Company's return does by Z prediction approach rather than p-value approach. Am I on the right track?
I don't get the point why to subtract from 1 when Z is positive. I'm examining a stock market index return's randomness and have N=764, R=415, E(R)=379,61, StDev(R)=13,69 and a Z of 2,58. Literature suggests that therefore the returns are not random, but subtracted from one Z is of course -1,58 (P=11,28% two tailed) and therefore they are random. I'm not sure how to proceed and how to interpret the whole thing, I find the "subtract from 1" pretty confusing.
Thanks for answering,actually, i was employing the runs test on a series of daily movements of a stock price index. The series was negatively skewed and if i am getting it right since runs test is non-parametric, so it does not matter if my data set is non-normal. The p-value is still calculated using the NORMSDIST function, right?
I think you have an error in calculating your variance. The denominator should be (N^2)(N-1), correct?
@ProfTDub ah okay. So the p-value in a one sided test shows how probable it is that the runs are less than expected. The 2 sided p-value shows how probable it is that the runs are less or more than expected? because im doing the financial crisis and i have sub samples for before, after and during the financial crisis ill do one sided. thanks for all your help
Pretty cool. Far easier to do than Eviews. :)
Can you Please Explain How to Calculating R Value?
Thanks alot brother, i appreciate this sooooooo much.
hi prof could you a demo on autocovariance and autocorellation of time series data? thanks
@ProfTDub do i get this 0.0973 by looking in the tables?
Hey Prof, first of all thanks for the great tutorial. And, second, how should i calculate the p-value is my data set is negatively skewed?? Thanks
I CAN NOT HEAR YOU
WHAT IS THE VALUE R PLEASE EXPLAIN
also does this work for weekly data?
@ProfTDub so should i be doubling my P value?
in your data R is not zero dear sir R is 21