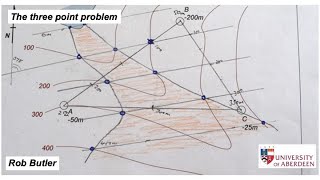
Interpreting a geological map - with faults

Vložit
- čas přidán 24. 07. 2024
- Part of the Shear Zone channel. This video is a worked example of geological map interpretation, illustrating the structure on a cross-section. The exercise involves faulted strata, and has been modified from one originally developed by Derek Powell. A downloadable version of the exercise is available in the "structural exercises" page on the Shear Zone website.


Tank you. For your interpretation very helpful
It very use ful sir keet upload more videos
really very useful. loved it
I see that this is a superb example to understand various key concepts while drawing subsurface profiles, although I am curious regarding the assumptions concerning varying thicknesses in a fault bounded basin (fold-thrust-belt), where more often than not, I would expect more thickness on the hanging wall of the normal fault (and footwall in case of reverse fault)? for example, the conglomerate layer in given example
I'm not sure I understand your question - the example shows listric normal faults so yes indeed, stratal packages thicken on the hangingwall sides of faults. As you note, this relationship is reversed (thicker on footwall side) for thrust faults...
@@robbutler2095 thanks for explicit comment, I was looking at the thicknesses of conglomerate layer in the two fault hanging walls, where in fault Y, it has more thickness compared to the fault X, and both are normal faults, but looking at the order of faulting happened, I got to understand it. Thanks
👏👏👏👏👏👏👍🏻