Least Squares vs Maximum Likelihood

Vložit
- čas přidán 2. 08. 2024
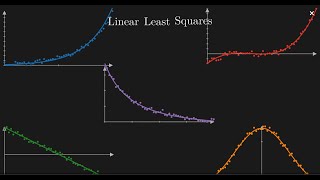
- In this video, we explore why the least squares method is closely related to the Gaussian distribution. Simply put, this happens because it assumes that the errors or residuals in the data follow a normal distribution with a mean on the regression line.
References
▬▬▬▬▬▬▬▬▬▬▬▬▬▬▬▬▬▬▬▬▬▬▬▬
Multivariate Normal (Gaussian) Distribution Explained: • Multivariate Normal (G...
Related Videos
▬▬▬▬▬▬▬▬▬▬▬▬▬▬▬▬▬▬▬▬▬▬▬▬
Why We Don't Use the Mean Squared Error (MSE) Loss in Classification: • Why We Don't Use the M...
The Bessel's Correction: • Why We Divide by N-1 i...
Gradient Boosting with Regression Trees Explained: • Gradient Boosting with...
P-Values Explained: • P-Values Explained | P...
Kabsch-Umeyama Algorithm: • Kabsch-Umeyama Algorit...
Eigendecomposition Explained: • Eigendecomposition Exp...
Contents
▬▬▬▬▬▬▬▬▬▬▬▬▬▬▬▬▬▬▬▬▬▬▬▬
00:00 - Intro
00:38 - Linear Regression with Least Squares
01:20 - Gaussian Distribution
02:10 - Maximum Likelihood Demonstration
03:23 - Final Thoughts
04:33 - Outro
Follow Me
▬▬▬▬▬▬▬▬▬▬▬▬▬▬▬▬▬▬▬▬▬▬▬▬
🐦 Twitter: @datamlistic / datamlistic
📸 Instagram: @datamlistic / datamlistic
📱 TikTok: @datamlistic / datamlistic
Channel Support
▬▬▬▬▬▬▬▬▬▬▬▬▬▬▬▬▬▬▬▬▬▬▬▬
The best way to support the channel is to share the content. ;)
If you'd like to also support the channel financially, donating the price of a coffee is always warmly welcomed! (completely optional and voluntary)
► Patreon: / datamlistic
► Bitcoin (BTC): 3C6Pkzyb5CjAUYrJxmpCaaNPVRgRVxxyTq
► Ethereum (ETH): 0x9Ac4eB94386C3e02b96599C05B7a8C71773c9281
► Cardano (ADA): addr1v95rfxlslfzkvd8sr3exkh7st4qmgj4ywf5zcaxgqgdyunsj5juw5
► Tether (USDT): 0xeC261d9b2EE4B6997a6a424067af165BAA4afE1a
#svd #singularvaluedecomposition #eigenvectors #eigenvalues #linearalgebra

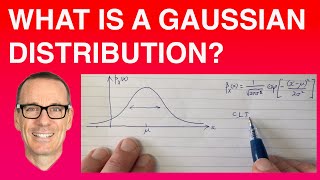


The equation explanation of the Normal Distribution can be found here: czcams.com/video/WCP98USBZ0w/video.html
I click on this link and it leads me to a video with a comment with this link, and I click on this link etc..., when do I stop?
The maximum liklihood approach also lets you derive regularised regression. All you need to do is add a prior assumption on your parameters. For instance, if you assume your parameters come from a gaussian distribution with 0 mean and some fixed value for sigma, the MLE derives least squares with an L2 regularisation term.
Its pretty cool
Thanks for the insight! It sounds like a really interesting possible follow up video. :)
Your math implies that the gaussian distributions should be vertical, not perpendicular to the linear regression line.
I agree. This would implies that the noise is on the Y variable, while the X has no noise
The visuals should have been concentric circles. The distributions are the likelihood of the hypothesis (θ) given the data, data here being y,x. It’s a 2D heatmap.
@@IoannisNousias ah, fair enough
@@placidesulfurik in fact, this is still a valid visualization, since it’s a reprojection to the linear model. He is depicting the expected trajectory, as explained by each datapoint.
I still remember when i thought i discovered this thing alone, and after i got a reality check that iit was already discovered
Great explanation of the intuition. Thanks!
Glad you liked it! :)
Una explicación breve y excelente de una duda que siempre tuve, muchas gracias
Este video sirve para refrescar la memoria, excelente
Great work !
Thanks! :)
awesome explanation
Glad you liked it! :)
Subbed! You love to see it.
Cool, thank you!
Thanks! Happy you liked the video!
love the video, seems like a natural primer to move into GLMs
Happy to hear you liked the explanation! I could create a new series on GLMs if enough people are interested in this subject.
great video! but what's the intuition on why gaussian distribution as the natural distribution here?
Central limit theorem. Natural random events are composed from many smaller events, and even if the distribution of individual events isn't Gaussian, their sum is.
You can think of the model as:
Y = mX + b + E
Where E is an error term. A common assumption is that E is normally distributed around 0 with some unknown variance. Due to linearity, Y is distributed by a normal centered at mX + b
You can derive other formula for regression by making different assumptions about the error distribution, but using a gaussian is most common.
For example, you can derive least absolute deviation (where you mininize the absolute difference rather than the square difference) by assuming your error distribution is a Laplace distribution. This results in a regression that is more robust to outliers in the data
In fact, you can derive many different forms of regression based on the assumptions on the distribution of the error terms.
@@MiroslawHorbalYes... like Laplace distributed residuals have their place in sparsity and all, but as to OPs question, the Gaussian makes certain theoretical results far easier. The proof of CLT is out there... it requires the use of highly unintuitive objects like moment generating functions, but at a very high level, the answer is that the diffusion kernel is a Gaussian, and is an eigenfunction of the Fourier transform... and there's a deep connection between the relationship between RVs and their probabilities, and functions and their Fourier transforms.
Given that the best estimate of a normal distribution is not normal, what would be the function to minimise? And what if the distribution is unknown? What would a non-parametric function to minimise?
According to the formula on 2:11, I don't see how the gaussian distributionas are perpendicular to the line, instead of just the x axis
Therefore, I believe you made a mistake in the image on 2:09
indeed
@3:14 is it really correct that st.dev does not depend on theta? I’m not sure as it depends on the square of the errors (y-y_hat) which depends on y_estimate which itself depends on theta.
I have seen the concept of least squares in Artificial Neural Networks, The material is very important for learning ANN