When you say that in the case of using 2 * IQR, some points that are outliers would not be considered outliers, what do you mean when you say they "are outliers"? By what other test are you determining that they are outliers?
In data analysis and to see the outliers, we are using a method of "Mean +/- 3 Sigma". Anything beyond it, we consider it as on outlier. (Let's take an example of Control Charts) Now, instead of "Mean +/- 3 Sigma", if we use "Mean +/- 3.375 Sigma", some outlier points will not be considered as an outlier. I hope this will help you. Thank you for your valuable comments. 😊
Ok, thank you for the reply. That helps me understand what you’re comparing against. I saw you say in the video that Q3 + 1.7 * IQR is closer to Mean + 3 * Sigma than the 1.5 factor for IQR. So why is 1.7 not used if it better approximates 3 Sigma? For that matter why not choose an even more closer approximation like 1.72 ?
Can you please revisit the content? Please visit to Normal Distribution video first. Might be it can help you. Thank you for your valuable comments. Please reply me here again.
Thank you for your valuable comments and appreciation! They are as per the sequence of creation. If you want to be part of most effective and practical training program, you can visit to successfulcareerhub.com/courses


Hi Vijay, Even my faculty didn't teach so clearly, Tq very much !!!
Thank you so much for your valuable comments and appreciation 🙏🙏☺
When you say that in the case of using 2 * IQR, some points that are outliers would not be considered outliers, what do you mean when you say they "are outliers"? By what other test are you determining that they are outliers?
In data analysis and to see the outliers, we are using a method of "Mean +/- 3 Sigma". Anything beyond it, we consider it as on outlier. (Let's take an example of Control Charts)
Now, instead of "Mean +/- 3 Sigma", if we use "Mean +/- 3.375 Sigma", some outlier points will not be considered as an outlier. I hope this will help you.
Thank you for your valuable comments. 😊
Ok, thank you for the reply. That helps me understand what you’re comparing against.
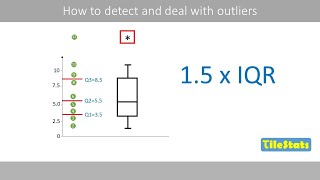
I saw you say in the video that Q3 + 1.7 * IQR is closer to Mean + 3 * Sigma than the 1.5 factor for IQR. So why is 1.7 not used if it better approximates 3 Sigma? For that matter why not choose an even more closer approximation like 1.72 ?
I have already explained that in the video.
Can you please see the video in detail?
I still not got the Idea of choosing 1.5 rather than 1.7
Can you please revisit the content? Please visit to Normal Distribution video first. Might be it can help you. Thank you for your valuable comments.
Please reply me here again.
Hi Vijay, this is indeed an interesting topic. I have not seen any video on CZcams who covered this topic. Thank you so much.
So nice of you! You're welcome!
Thank you so much for your valuable comments and appreciation 😊🙏
Hi, thanks for the videos. I find them very helpful. I'm just confused about the order of the videos in the playlist. Are they in order?
Thank you for your valuable comments and appreciation! They are as per the sequence of creation. If you want to be part of most effective and practical training program, you can visit to successfulcareerhub.com/courses
why only he choosed 0.67 and 0.68 in standard normal table
We are looking for a z-value associated with 0.25, which is between 0.67 and 0.68.
@@learnandapply why 0.25?
We are calculating probabilities at IQR (for data points between 25% and 75%).