Understanding the Discrete Fourier Transform and the FFT

Vložit
- čas přidán 16. 05. 2024
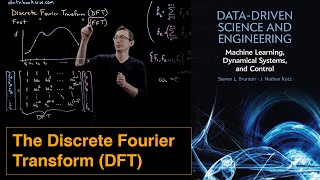
- The discrete Fourier transform (DFT) transforms discrete time-domain signals into the frequency domain. The most efficient way to compute the DFT is using a fast Fourier transform (FFT) algorithm.
This Tech Talk answers a few common questions that are often asked about the DFT and the FFT. It covers an overview of the algorithm where you’ll be walked through an understanding of why you might look at the absolute value of the FFT, how bin width is calculated, and what the difference is between one-sided and two-sided FFTs.
Learn more:
- How to Do FFT in MATLAB: • How to Do FFT in MATLAB
- What Is a Fast Fourier Transform? bit.ly/47uMTNu
- Veritasium: The Remarkable Story Behind the Most Important Algorithm of All Time: • The Remarkable Story B...
- FFT MATLAB App: bit.ly/FFT-MATLAB-App
--------------------------------------------------------------------------------------------------------
Get a free product trial: goo.gl/ZHFb5u
Learn more about MATLAB: goo.gl/8QV7ZZ
Learn more about Simulink: goo.gl/nqnbLe
See what's new in MATLAB and Simulink: goo.gl/pgGtod
© 2023 The MathWorks, Inc. MATLAB and Simulink are registered trademarks of The MathWorks, Inc.
See www.mathworks.com/trademarks for a list of additional trademarks. Other product or brand names may be trademarks or registered trademarks of their respective holders. - Věda a technologie


![[Vowel]물고기는 물에서 살아야 해🐟🤣Fish have to live in the water #funny](http://i.ytimg.com/vi/3G9MH063Cx4/mqdefault.jpg)

Hi everyone! Thanks for watching the video. If you have any questions or comments please leave them here and I'll try my best to get back to you. Cheers!
Why are your videos so great?
Can you make a video of model predictive control? Or like an overview of advanced control theories?
@@xptransformation3564 Thanks! MathWorks already has a series on MPC so I probably won't be making one also. An overview of advanced control theories sounds like a good idea! I'll add that to the list.
I would like provide azerbaijani translation of The Map of Control Theory. How can i contact you?
@@murad_aliyev through the contact form on engineeringmedia.com. I usually respond there but sometimes I get busy and miss some. I'll look out for it.
Awesome video! It would be very good if you can also consider preparing some contents about short time FFT, Cepstrum, Hilbert and Wavelet transformation topics :)
Great lesson! I am now learning Fourier series, and getting an intuition is awesome.
I understand that DFT converts a signal to its frequency domain but never knew how these tools actually work. Really appreciate the DFT calculation example. Felt like this is what my teachers has been missing, they focus more on the theory and the equations and the derivation and never really put time to show actual example. Thanks!
Great! I'm glad it helped
Such a fantastic and helpful explanation. Thank you!!
awesome, this lesson illustrate the fundamental principle of FFT intuitionally clear
Thanks Brian for great explanation. Would love to see you cover continuous wavelet transform, cwt stuff too. One can only hope..
Great explanation. thank you.
High above splendid!
Fundamentntally charming knowledge You have presented! All dramatic suprises bring to us ( me) so clearly! FFT is presented like it is - algoritham the data are into a file and transform is carried out so the file can containing the dots (points) of the transformed function. I am indeed out of speach, because you generally associated FFT and DFT with Dirac comb with the integral finit limits. Like you imply Nyquist as the highest frequency and Power Theorem like Parseval's Theorem for waveform. Good luck with spectrum it is so usefull and all is a metter of interest of solar energy, waveforming, signls, accustic - multidiscipline approach! Brilliant 👆👏
Nice video as usual. Great job thank you.
Great video, thanks for making 😊😊
Best Explanation 👏
Very good illustration
very good video :)
I think that shedding some light on the inverse DFT during the video would have been beneficial. it shows that you can reconstruct/synthesize the time domain signal by adding a bunch of complex exponentials.
Great explanation, thanks a lot!
Thanks for the video.
Can't wait. Is there is any video like this you upload before.
This is the first time that we've done a premier on a video that I've made and this is also the first video in a series on signal processing. I'll be on when this goes live to chat with people while it plays. There will also be some signal processing experts from MathWorks to answer any questions. Hope to see you then!
@@BrianBDouglas wow. Thank for your kind reply. I follow your lectures for 3 years. These are very useful. I'm so happy to get your lecture on signal processing. Thank you.
I LOVE your videos Brian!!!
🥰
the lord of control Brian is back
👋
I have searched and searched for a good video on DFT. By far this is the best one to clear some of my doubts. But I am still struggling with some things. Like why the frequency is given by, frequency = k/length of the signal
I am not really getting the intuition of this thing. Please explain. I really need it.
I really appreciate of it. helped me a lot
For Brian, first like and then watch.
Amazing ❤
At 12:45, I think that plus one means zero frequency, which is not captured by the right half of FFT.
@BrianBDouglas is it possible for you to include the wavelet transform in this series?
Bump this, I would also like a Video about the Wavelet Transform.
Hi,
Back in 1998 I was given a new boss.
He moved into the office and setup his pc.
In Excel he had a button for doing FFT.
I always wanted to get an fft function in my Excel but the boss got expired before he could tell me anything about it.
How to get fft in Excel?
Thanks.
Thank you Control system God.
Hey, thanks for the great video and the explanation.
One question: I don't understand why the y-values (amplitudes) are so different when comparing the DFT formula you showed (video: 3:10) with the FFT in Matlab (video: 17:37). I can't get back to the real amplitudes in the manually programmed DFT with the formula video 3:10. What is the reason for this?
I'm sorry, I'm not following the question. Are you saying that the FFT() command in MATLAB doesn't produce the same Y-values that you get if you manually code the DFT formula? Could you expand on your question so I could answer it?
Why do you say the value of the DFT is "near zero" instead of exactly zero when k = 0 and the positive and negative values of the signal cancel each other out? Excellent video by the way, thank you very much.
Dude thank you so much ypu are god
Hello. Thanks for your video. I have a question.
What is the number of samples I should have for my DFT? For example, if my sampling frequency is 100Hz. Do I need to take 100 samples (or N = 100). I checked the code and saw that if I take a different number of samples, such as N = 200, the result is different. I don't understand why.
Hello, I explain the impact of having more samples starting at 14:40. There isn't an exact number that you're shooting for, it depends on the signal and what you're trying to get out of it. The more samples you have the narrower the bin width. If you're adding more signal then the result will look different because - like in my example - you're adding more values to the signal frequency bins but not necessarily to the noise bins. However, if you are adding more samples by zero padding then you're just interpolating between the frequencies and not actually changing the data you're seeing. I think I was more clear in the video so I hope this helps!
Got a question. If we be very precise, (which is necessary for understanding this concept), whiy is the frequency equation freq=k/(time length)=k*fs/N? When I write it down, given N samples starting from 0s, the overall time length is (N-1)*T=(N-1)/fs, and as a result shouldn't freq=k/(time length)=k*fs/(N-1)? My understanding is that for a big N, there is almost no difference, but if say, we only have 10 samples, there seems to be a noticeable difference in the bin width, since then the time legnth is 0.9s instead of 1s.
I think the answer is that we're dealing with discrete time and so each sample represents 0.1 seconds in your example. So, the sample at 0.9 covers the time span from 0.9 to 1 seconds. So 10 samples does cover 1 second even though the first sample is at 0 seconds and the last sample is at .9
I will teach my kids FFT using this video, assuming I will have any.
Hello, i tried and i had a lot of data, the first part i got something, the second part refused, the part where the code is supposed to do a stem, syas invalid expression, anyhelp
I had to replay the section at 3:20 a few times before I realized what was going on. I could not understand why “1” and “9” would produce the same frequencies and thought I was missing something. It’s just severely under sampled.
How would you suggest I prepare data for an FFT that has occasional gaps in its sampling? Say 1 kHz sampling rate with occasional 100 ms gaps
When you say gaps, are the data missing, or do you just know that the sampling was irregular. If the data is missing, the best thing to do is to interpolate the data to fill in the missing values. If the data is there, but you just know that a glitch occurred then how big is 100 msec in your scenario, if 100 msec is inconsequential, you can just treat the data as uniformly sampled and you're likely OK. In reality all samplers have some jitter. If 100 msec is really a significant gap (which appears to be the case in your scenario since 100 msec is 100 samples), then again you can interpolate the data onto an evenly sampled grid.
@@wayneking1995 I’m referring to missing data in this case. Such as some buffer filling up and samples being dropped until the data logging software catches up.
In my specific application I think these gaps are in fact small enough and infrequent enough to ignore
@@JKTCGMV13 Then I would suggest interpolation.
👏 nice
Can you please talk about when we have to calculate N point DFT on a M point signal. How to do it.
Suppose there is need to Tune to FM radio via Digital algorithm and with associated hardware , then ADC might provide M ( 1.2e6) samples per sec and N is1024. In this case compute N point DFT and take decision on FM channel presence. or perform 10 time N point DFT and decide on FM channel presence. This will work well for Digital Tuning. //
The "how" is trivial. Just use the available fft syntax variations in MATLAB. Y = fft(X, N);
www.mathworks.com/help/matlab/ref/fft.html
When/why - for example:
N < M ---> Update your analysis every M/fs time period, have a bin width or fs/M,...
N > M ---> Decrease your bin width, "interpolate"/"smothen" your frequency domain representation (when padding with zeros)
Is N here bigger or smaller than M? In either case, in MATLAB you can use fft(x,N) to compute the N-point DFT. In the case that N > M, that will zeropad the data out to N samples. In the case that N < M, you will get the DFT of the N-point truncated signal.
@@GabrieleBunkheila I want to calculate manually and not use MATLAB, I am from mechanical engineering, so I don't know how to proceed with it
@@wayneking1995How can I do it manually
不错
Your PDF version???
I really wish matlab had a OneSidedFFT() function so I don't have to manually tweak the inputs and outputs of fft() so much.
Yeah, unfortunately that's not an option. But it's just a single extra line to grab half of the output and the input doesn't need to change. If you're looking for power spectrum, however, you could use periodogram which does have a one-sided option.
You can use fftshift() when plotting to help.
Are there any factors can influence the efficiency of FFT implementations?
Yes, but typically there is no such thing as THE FFT. Most modern computing packages, MATLAB included, actually have several FFT algorithms depending on characteristics of the data. What happens is that the software actually looks at the data, is it even or odd-length, if it is even, is it a power of two, and a number of other characteristics to come up with an "FFT plan" (yes that is actually what they are called). This is what is used to decide which FFT algorithm is actually called to operate on the data. So, quite a bit of planning goes it to deciding which FFT algorithm is the most efficient one for the data characteristics, it just happens very, very fast.
9:43 don't do my man Shannon dirty like that 😭
Gah! Good catch. I'll name my next born child Shannon to make up for it
Why only sin and cosine functions not any other?
In general, we can describe a time series with any set of universal function approximators. But sines and cosines (or e raised to an imaginary number) are useful since they describe oscillations and frequency. They are also unique in that they don't change their general shape when you take the integral or derivative of them. Therefore, they are the solutions of differential equations which is what we use to model dynamic systems. Maybe someone else can chime in with a better response because I'm just sort of riffing here. :)
I'm not a mathematician but I guess because in LTI systems if your input is a cosine (or sine), then the output will be another cosine (that could have different phase and amplitude but still it's a cosine). You can then apply the superposition theorem, which says that the output given by the sum of the inputs is equal to the sum of the outputs given by singular inputs!
Basically, cosine and sine are the "fundamental" elements
It looks like Brian is recruited by Mathworks now.
I've been making videos for MathWorks for 6 years ☺