Perform Chi-Square Test Of Independence In Excel (Including P Value!)

Vložit
- čas přidán 3. 07. 2024
- In this tutorial, I will show you how to perform a chi-square test of independence by using Microsoft Excel. This includes step-by-step instructions, to generate a p-value.
ONLINE GUIDE
toptipbio.com/chi-square-test...
VIDEO CHAPTERS
00:00 Intro
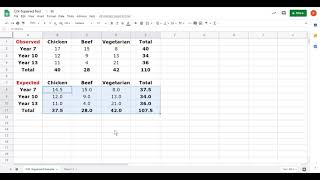
00:18 My example data
00:58 Calculate row and column totals
02:50 Calculate expected values
04:11 Calculate difference between observed and expected
05:12 Calculate the chi-square value
05:39 Calculate the degrees of freedom
06:06 Calculate the p-value
07:37 Using the CHISQ.TEST function
08:10 Wrapping up
HOW I CREATED THIS TUTORIAL (AFFILIATE LINKS)
Screen recorder & editor techsmith.z6rjha.net/c/198849...
CZcams SEO www.tubebuddy.com/SHTeach
Software (Microsoft Excel 365 ProPlus)
FOLLOW US
Website toptipbio.com/
Facebook / toptipbio
Twitter / toptipbio
AFFILIATE DISCLAIMER
Some of the above links are affiliate links, meaning I will earn a commission if a sale is made after clicking on the link. - Jak na to + styl


ONLINE GUIDE
toptipbio.com/chi-square-test-independence-excel/
You became my favorite person in the world. I was really stressed out because a couldn’t calculate the chisq to a result of an investigation, but you explained super clear and finally i can finish my project. Thank you so much!!!
A video from 2 years ago SAVED MY LIFE!!!
Thank you for such a great explanation!!!
you just got cited in my lab report since I used your methods in my methodology and results section for my results, thank you.
You are so amazing! The explanation was crystal clear! You’ve literally saved me!! Thank you so much!
Thank you for this. As someone who hasn’t done stats for 20years this was by far the easiest to follow explanation I have found.
Easiest video on chi square. great job.
I want you to know that this video literally saved my day. I have to take a poster to a conference and I kept getting recommended using one-way ANOVA, which gave me very silly results for my binomial data set. Thank you very much friend
Thank you! This is so much easier and so much clearer than any of the others!
Oh my, this helped me SOOOOO much!!! Thank you!!
I have an exam from statistics. You are my savior! Thank you.
Thank you. Very Good, Simple and Easy to understand
Your video SAVED MY LIFE!!! Thank you so much for such a wonderful & easy explanation
Thank you so much, i was so stressed and did not find anything helpful until i came across your video. You saved me and my thesis, I can not thank you enough😓❤❤
thank you i love you you’re a gift of god thank you
thanks for the video, it's very clearly explained.
You are truly amazing ... I was tensed due to details mentioned in literature and now uou made it soo simple and easy to implement... wow love your work
Thank you so much for this. It was very helpful for me as a beginner. Your flow of teaching was also right for me. 👍
Thank you so much for this video! So helpful!
Super helpful for my Botany students when analyzing their experiment data. Thanks!!
Thank you so much!!!!!!!!!!! Made it so simple!
Thank you so much, you saved my day
Thank you so much for this, it was extremely helpful!
Thank you 🙏🏻 for making this video
This was superrrr useful thank you so much.
Great tutorial!!!
Thank you so much for this! This was great
Thanks, I liked your tutorial
Very much appreciated. This helped me cut down 3 hours of hand work down to 30 minutes of excel. You are a life saver. Now if i can just get my group to contribute with our work it will be even less time consuming LOL.
Excellent. Thank you so much.
thanks a lot. my work got a lot easier after watching this. 😁😁
Thank you so much sir!❤️❤️❤️
Thank you so much for this video. I suck at statistics and Ive got a paper due tomorrow and this has helped me solve a data set in under 2 hours compared to the over 6 hours it took to solve a different data set yesterday :)
Very helpful, thanks
THANK YOU so much!!!!!
Thank you so much! So helpful and easier to understand than Coolican. :D
Thank you for this. You just saved my life literally😂
WELL EXPLAINED
You are a legend sir
Thank you
Thank you so much
thank you, you save my test
Thank you so much you saved me for my test
Great content
Good job for students, thanks very much
THANK YOU SO MUCH! This taught me more than my class lectures lol
You're very welcome!
So simple and easy to follow, thank you!
thank youuuuuuuuuuuuuuuuuuuu for this
Excellent 👍👍👍
Super tutorial Sir
bless you king
THANK YOU VERY MUUUCCCHHHHHHHH
Really the best channel in the world many thanks for this brief explanation I am really very satisfied , can you please go with us step by step from downloading R and R studio and show us how to use R we are struggling and the information online is not enough to work on this programme thanks
Legend!
Nice
Nice ❤️ ❤️ ❤️
thanks sir
fine
Thank you, How can we test it for a single variable?
Thank you so much. Can we apply it if the total sample number is 25? Thank you, I really appreciate it.
Hi Steve
Thanks so much for your video - really useful. However, how do I do the Chi square test for proportions with more than one categorical group. For example, I ask 3 cohorts (healthy, anxious and depressed) if they smoke (yes/no)? Thanks in advance
can you do one of these with one row and two columns
how to do it in r without built-in func?
Can I use chi square if I have 4 independent variables to be tested against a Yes or No response? If not, what’s suitable for such analysis?
Thanks in advance 🙏
Its very helpful. Thanks. What means if P-value is zero?
It van never be zero, as there is always the smallest probability that it might actually happen
Can I use this method with multiple choice questions?
i have a 2-way table with some zeroes in the data set, i cannot find the chi square test in many calculators , can you help? @top tip bio
is there a calculator which has the chi-square function but which is non-programmable? because in the exam I am not allowed to have a programmable calculator.
Can the interdependence of the categories be established simply by using the Observed values and not using Expected values?
Clutch
Hi, I was curious why you did not have to use the Chi-Square possibilities table in order to determine if you reject the null hypothesis? Why did you default to alpha 0.05?
.05 is the most common convention and means there is only 1 chance in 20 this result happened by chance. You could choose .01 for a more strict test of 1 in a 100 chance or .10 for 10 out of 100 to be less strict in ruling out the null assumption.
is it also applicable when you have, instead of female and male, you have three ages (examples are 18-19,20-21,22-23)?
why am i getting 2 different p-values when I use CHISQ.DIST.RT vs CHISQ.TEST
I noticed same. I think CHISQ.TEST works for only 2×2 table
@@ogechichilaka6294I got different results for even 2×2 table
is it association of gender to smoking or the unequal distribution of gender between the groups? Can we say that both groups have unequal sample distribution for each sex? What i mean is can i have test for gender distribution between both groups?
how do i find my alpha level??
Sir, I have a doubt. you have done for 2*2variables..Can we do it for 3*3 variables..Is it correct to do chisquare test for 3*3 variables
It displaying a syntax error message
The values of p are like 0.7,0.8 , 0.8 , 0.4 etc
Is this a problem . Because i knoe is should be less than 0.05
If we can accept or reject the null hypothesis based on the chi-square value alone, then why is there a need to derive the P value from it. Why an extra step?
Actually you can only reject or fail to reject null hypothesis.
According to you, the Null hypothesis will be accepted if P > 0.05 and rejected when P < 0.05. This is opposite to what this gentleman is stating. Which one is correct? czcams.com/video/WXPBoFDqNVk/video.html
Who else is here from Rosemary Wilsons bum ass class ?
Thank you so much