Tableau Dashboard Tips [Top 10 Tableau Dashboard Design Tips]

Vložit
- čas přidán 3. 08. 2024
- Stop showing crappy dashboards and learn some tips the PRO’S use.
Free Top 10 Tableau Dashboard Tips - vizual.consulting/dashboardtips
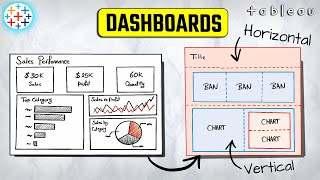
So you have all your charts built out now it’s time to put it all together. To me, this is the most important step because this is what you end user is going to see. Your analytics could be badass but if it looks like crap no one is going to want to use it. You have to make your Tableau dashboard user-friendly and visually appealing. Here are the top 10 things I do to each Tableau dashboard.
---------------------------------------------
ABOUT VIZUAL INTELLIGENCE INC.
Vizual Intelligence Inc. is an Innovative, Creative and Effective Tableau Consulting & Training Company led by a young entrepreneur with a goal to use his expertise with Tableau to revolutionize your business intelligence.
Tableau Consulting: vizual.consulting/home
Tableau Training: vizual.consulting/training
Tableau Survey Analytics: vizual.consulting/analytics
Our blog: vizual.consulting/blog
Tyler Lubben, MBA vizual.consulting/linkedin
#tableau #tableautraining #tableaututorial #tableautiptuesday - Jak na to + styl
![Tableau LOD Expressions [Overview of Tableau Level of Detail Calculation]](http://i.ytimg.com/vi/IvZd1L9zWxo/mqdefault.jpg)
![Tableau LOD Expressions [Overview of Tableau Level of Detail Calculation]](/img/tr.png)


Why has no one showed me how to set up and customize the look of my desktop before? Love it thanks!
Its good to be able to make your dashboards "pretty" lol Welcome
1. Resize Dashboard
2. Format Shading and Background/ Title
3. Add logo to top left
4. Use containers to organize dashboard
5. Update tooltip
6. Add filters for interactivity
7. Float your legends
8. Move your filter containers and format nicely with title
9. Create icons that you can hover over to give more info 9:00
10. Add some header summary info
Not the hero we needed, but the hero we deserve!
use timestamps!
@@mohitupadhayay1439 Ingrate. LOL
Hero.
This is GOLD.
I was just created my first ever project after learning tableau. This video showed me that my project is still naked. This is awesome
This is a simple, yet effective and appealing dashboard, which clearly explains everything for the end user. Thanks a lot!
Very good video. I’m a business analyst but very new to Tableau and dashboard design is quickly becoming a requirement so this has really helped!
Really nice tips. Not known these tips before watching this video. Thank you
Super helpful! Thank you so much! I really needed these tips!
Thank you! Love the wrap up at the end.
Brilliant video. Thank you so much for being willing to share.
Thank you for sharing knowledge! Very good tips!
Thank you very much, I learn a lot from your tips.
Excellent Tableau Dashboard tips. Thank you!
Your video has helped me a lot. Thank you.
Outstanding! Very easy to understand, making great looking dashboards in just a few minutes!
It just takes a few tips to make some attractive dashboards. When you make something cool, i would like to see it. Send me a link!
This is life saving. Thank you so much!
The best Tableau Dashboard video I've watched so far.
Thank you.
its really great tutorials. thanks alot !
Thank you it's extremely helpful!
I just have one question : I find that annoying that the icon is set as floating because it can't set the size of the dashboard as automatic. If I want to share this with somebody else it will mess up everything and I don't even know where the icon will be on the dasboard. Do you know if there's a way to anchor a floating element?
WoW!! Loved this video. Thank you for your effort. it is very very VERY helpful.
Allahu Akbar!
Great video, very helpful as a relatively new user of Tableau!
Great tutorial. Thanks for sharing!
Thank you so much, this improved my first Dashboard 10x!
Thankyou...i’m going to make my first dashboard tomorrow and these tips are Definitely gonna help me...thanks again
Nice share your work with us.
Amazing tutorial!!
This is so helpful, wow. Thank you!
This video is clear and useful. Thank you so much !
"?" part is the best!
Thank you man, simple and easy.
Very clean video, thanks!
Seriously I did not know this earlier even my lecturers did not teach me on this techniques. Thanks
That is most wanted video to Tableau developer. Thanks
Congratulations .... very straight forward of what really matter ... Perfect
thanks
Great video. Thanks for sharing!
Great tips :) Thank you for this!
Thanks for your feedback.
Brilliant!Thank you
thank you so much. it's great.
Thank you. This is a nice, quick tutorial.
It would be great if you can show how multiple tables can be arranged in a dashboard. Also, hardly I've seen dashboards with maps (Probably coz it's not used much outside in US ?? ) or even if its US, the definition of region/area differs based on company you work for
Very Good Tutorial
Good Stuff, Thanks
this was really helpful and concise!
Very nice explanation. Love the "?" part. But - all floating objects will not stay as they are in the design mode when seeing on full screen published dashboard. Any tips on that?
that's why you use containers, he should've done that. I know he used "some" containers, but he should've used more
Really useful tips for Beginners like me 👍😃
Thank you! This is very useful 🙂
Straight to the point .. thanks
where did you get the worksheets from? great video and I subscribed to your channel!! Thanks
Its amazing how building a dashboard like this in excel would've taken 5 hours lol
Hahaha seriously
In Excel you can do a good dashboard. Tableau limits you to make a basic dashboard.
In Excel I can do a good chart in a couple seconds. Here I need to go around all the buttons to make it my way.
It depends. Excel has things that tableau doesn't have. Both have their own use cases though
Well demonstrated.
Amazing! Thanks!
thanks very much!
Many thanks!!!
Welcome more videos are coming stay with us.
Hi, may i know where i can download the data set for this tableau dashboard?
Solid advice
Hope to see your response! When we custom a dashboard with a specific size. How do we set the dashboard to be shown in the center of the screen after publishing it to the server? Because it always stays on the left of the screen. Thanks!
good tips
Welcome more videos are coming stay with us.
Excellent
NICE!
thanks a lot
i have a small question related to the sheet "Customers by state", why are some of the names of the states are not showing up in the map. for example: States like Virginia and georgia are not showing in the Maps while they are present in the Data source. Waiting for your response
My guess is some of the states' names are too long for the area and can't be displayed without it getting ugly. Imagine the Northeastern states that are all tiny and right next to each other having their names displayed.
Awesome.
It's amazing....
So you created Icon worksheet just for the tooltip?! I honestly didnt get the practical use of it 🤔
If show presantation mode
The Icon(?) position was changed
How to fix same position at presantation mode also
Anyone that has used Tableau in the real world knows that floating objects is never a good idea due to the inability of the tool to render floating objects properly across various display mediums.
you are awesome, thank you.
What file extension do you use for logos, SVG?
I use png
Nice tips . Thank you .
How did you create that map?
Thanks for the question. Check my recent videos where I showed how I make map in Tableau
TOOOOOOOO BAAAASSSSSIIIIIIICCCCCC
好BI
tyler fking 1!!!
Leaktableau
Way too fast - and doesn't list the separate tips. Just flies through the presentation as fast as he can.
Anyone from ExcelR here?
No I havent played with that yet
The customer by state chart is hideous.
Yeah not the most beautiful chart I agree, just trying to do a quick example
oh that's how you talk from yur nose :-)
Tableau is so bad. I tried to make my own dashboard and I quit-raged. Microsoft does better