Video není dostupné.
Omlouváme se.
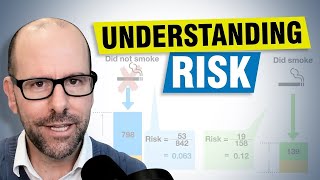
Odds Ratio, Relative Risk, Risk Difference | Statistics Tutorial #30| MarinStatsLectures

Vložit
- čas přidán 18. 08. 2024
- Odds Ratio, Relative Risk, and Risk Difference: How to Use Odds Ratio, Relative Risk, and Risk Difference to Describe the Association Between Two Categorical Variables.
👉🏼How to Use R to Calculate Relative Risk, Odds Ratio & Risk Difference ( • Odds Ratio, Relative R... ) 👍🏼Best Statistics & R Programming Language Tutorials: ( goo.gl/4vDQzT )
►► Like to support us? You can Donate (bit.ly/2CWxnP2), Share our Videos, Leave us a Comment and Give us a Like or Write us a Review! Either way We Thank You!
In this statistics tutorial, we discuss measures of association between 2 categorical variables (or factors), such as the Risk Difference, Relative Risk, and Odds Ratio. The Relative Risk also gets referred to as a Risk Ratio, Rate Ratio, Relative Rate, Incidence Rate Ratio, or Prevalence Rate Rati. The Risk Difference also gets referred to as the Attributable Risk. Odds Ratio, Relative Risk, and Risk Difference are all slightly different ways of describing the association between two categorical variables.
The statistics video does show the calculations for Odds Ratio, Relative Risk, and Risk Difference, but the focus is on the concepts
▶︎ In a separate video, we expand on the idea of an Odds Ratio, and why one might calculate that instead of the Relative Risk
► ► Watch More:
► Intro to Statistics Course: bit.ly/2SQOxDH
►Data Science with R bit.ly/1A1Pixc
►Getting Started with R (Series 1): bit.ly/2PkTneg
►Graphs and Descriptive Statistics in R (Series 2): bit.ly/2PkTneg
►Probability distributions in R (Series 3): bit.ly/2AT3wpI
►Bivariate analysis in R (Series 4): bit.ly/2SXvcRi
►Linear Regression in R (Series 5): bit.ly/1iytAtm
►ANOVA Concept and with R bit.ly/2zBwjgL
►Hypothesis Testing: bit.ly/2Ff3J9e
►Linear Regression Concept and with R Lectures bit.ly/2z8fXg1
Follow MarinStatsLectures
Subscribe: goo.gl/4vDQzT
website: statslectures.com
Facebook:goo.gl/qYQavS
Twitter:goo.gl/393AQG
Instagram: goo.gl/fdPiDn
Our Team:
Content Creator: Mike Marin (B.Sc., MSc.) Senior Instructor at UBC.
Producer and Creative Manager: Ladan Hamadani (B.Sc., BA., MPH)
These videos are created by #marinstatslectures to support some courses at The University of British Columbia (UBC) (#IntroductoryStatistics and #RVideoTutorials for Health Science Research), although we make all videos available to the everyone everywhere for free.
Thanks for watching! Have fun and remember that statistics is almost as beautiful as a unicorn!
#statistics #rprogramming


Doing a masters degree in Public Health/Epidemiology and Im bad at math!
I felt so so lost until I found your videos, thank you from Ireland
It's really nice the way that you focus on the concepts and not on the calculation. Also, nice effect you use for writing on our screen hahaha. Already subscribed!
Very informational video as always! I will keep my eyes on the papers where those terms are used...
Very well explained, thank you so much!
Great 👍
You are a legend
And I can’t believe we have to know this for secondary school GCSE Statistics
thanks, glad you found it helpful.
and id say not just for school, but knowing statistics is a huge asset for your entire life....ive been able to make much better decisions in my life once i learned about statistics and probability.
Great , simple , and to the point , thanks for your efforts
thanks a lot. I finally understand the difference between these terms.
Thanks a lot, i really appreciate that concept.
very nice work! help me a lot! Thank you so much! Could you add some content about longitudinal data analysis?
Thank you so much sir ☺️ it's useful for my exam ❤️❤️❤️
You mention that you can take this a step further and get a p-value. Is there a video on that when considering exposure? (Finishing my dissertation, wish I would found this channel sooner!!)
Hi Marin, thank you so much for these excellent posts, we can get an odds ratio with epiR, also, we can calculate the odds ratio with regression through coefficient
, could you give some thoughts about the difference?
They’re the exact same thing (in the case of one X one Y, both dichotomous). But with logistic regression you can calculate an OR adjusted for other variables (Eg) the OR for X1 effect on Y, adjusting for X2, X3 and so on. Hope that makes sense
Great video!
Excellent review
Dr. FARES EL-KATRI
thanks, appreciate that!
Well-explained, and concise video on these concepts! Thank you for your help! Keep up the good work :^)
awesome
Thanks for the lecture, I enjoyed it a lot. Do you have a lecture for sample size calculation. Need to understand sample size calculation for a comparative quantitative variable
We have a video showing power calculation for one quantitative variable, although doing this for, say a difference in means, is nearly identical..you can see that here: czcams.com/video/ryWoLqe0sd8/video.html
If RR is 3.3 (95% CI, 2.4-4.3 p
Great!
Thanks, man! Can you suggest the books you refer for your teaching material?
i domino really use a book, for my courses, i use a set of notes that i have written myself...they are very much like a text, but nothing that is published.
@@marinstatlectures We looking forward for your notes!
thank you
You’re welcome :)
Did you learn to write backwards for this video??
no, but it certainly looks that way ;)
@@marinstatlectures i'm impressed!
lol, the way it works is I'm writing on a piece of glass with a camera on the other side of the glass. after recording, the image is mirrored, so things appear the right way instead of backwards. it's a cool and simple idea. search "light board" if you want to see more about how it's done
@@marinstatlectures it's interesting, but I'm not sure it's necessarily something I'll get to use other than perhaps in a few presentations - cheers!