Adjusted R Squared, Clearly Explained

Vložit
- čas přidán 6. 09. 2024
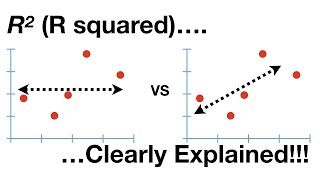
- Looking to learn about Adjusted R Squared? Adjusted R-squared is a statistical measure that compares the fit of a model to the average of all possible models. It is a modified version of R-squared that accounts for the number of predictors in the model. A higher adjusted R-squared indicates a better fit of the model to the data. It also penalizes the addition of unnecessary variables to the model. Adjusted R-squared values can range from 0 to 1, with values closer to 1 indicating a better fit. Learn more in this video!
Course Link HERE: sds.courses/py...
You can find us also here:
Website: www.superdatas...
Facebook: / superdatascience
Twitter: / superdatasci
Linkedin: / superdatascience
Contact us at: support@superdatascience.com
#AdjustedRSquared #machinelearning


Thank you for subscribing and following our videos. You can find the course HERE: sds.courses/python-ml-level-1
well done, explained very clear!
I am not able to Understand Adjusted RSquare, can someone help.
n - k - 1 is called the degrees of freedom of the linear equation, correct?
Ye😊
Greater R^2 values are NOT necessarily better
what do you mean by variable? a variable, the variable? or just numbers, or observations? So many fkin terminology, words, words! Anyway, so you have the A (Y axis) and B (X axis) variables.By adding a variable you mean adding C, so multinomial? If I have 2 variables, adjusted R2 should be the same as normal one? Its not.